
All Devices view
To go to the All Devices view (formerly known as the N-sight RMM Dashboard), click All Devices in the Left navigation.
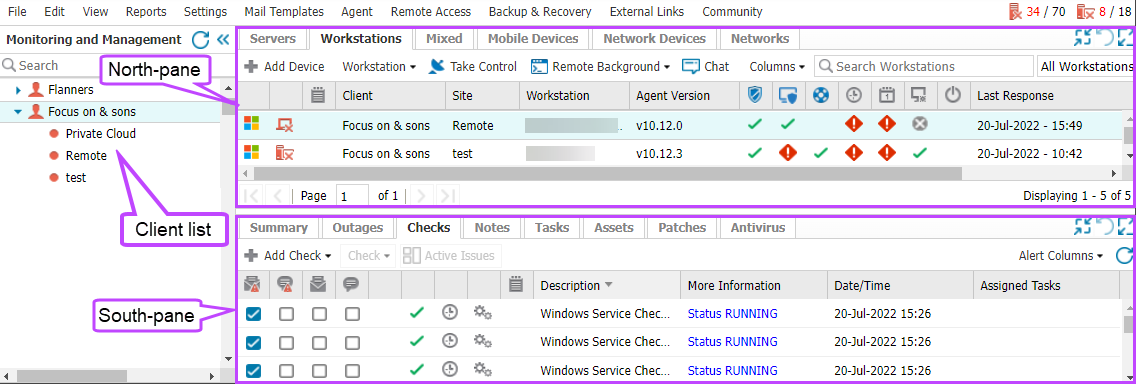
Using the All Devices view, you can manage and monitor your clients and sites, their devices, and device details. You can also enable features, configure alerting, and setup and view reports. The All Devices view includes the following main sections:
- Client List — lists the Clients (Departments) and Sites
- North-pane — contains the Servers, Workstations, Mixed (Servers and Workstations), Mobile Devices, Network Devices, and Networks tabs
- South-pane — contains detailed information based on the North-pane selection
You can customize your All Devices view to view, hide or resize sections, use filters and columns to focus the information, choose a default tab, and more. You can also reset the All Devices view layout to the default.
The All Devices view automatically refreshes after five-minutes of inactivity and you can manually refresh the full page, the North-pane and South-pane to ensure you are viewing the latest information.
If a device is recently added, you may need to refresh your All Devices view or browser to view its information.
Client List
The Client List shows a hierarchical view of all your Clients and Sites. When you select a Client or Site in the menu, the North-pane automatically updates to display information for the selected item.
When you search for a Client or Site using the Search field, the Client List automatically updates the list of Clients.
You can configure the Client List sorting behavior using View> Sort Clients. Select the problem type that highlights Clients in red and shows them at the top of the Client List. You can select Server Problems and/or Workstation Problems.
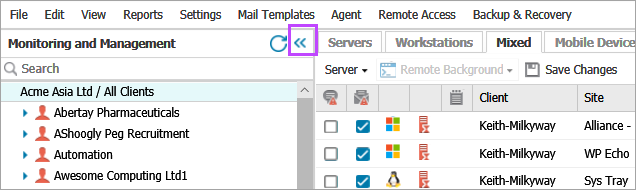
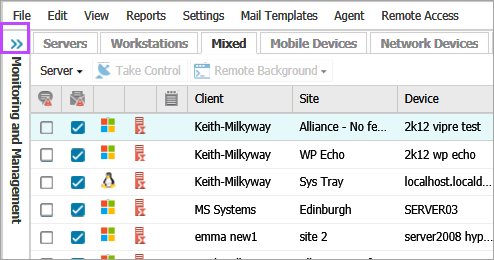
You can compress or expand the Client List using <<.
North-pane
The North-pane contains the Servers, Workstations, Mixed (servers and workstations), Mobile Devices, Network Devices, and Networks tabs, which display high-level information about each device. For example, there are columns to show Client and Site names, columns to indicate which features are enabled, and when the device last responded to N-sight RMM.
Windows workstations that are set to Server Mode during a manual Agent installation display in the Server tab and Mixed tab.
In addition to the filtering options on the North-pane, you can also filter the device information using the Device Inventory and Filter Manager.
When you select a device in the North-pane, more in-depth information displays in the tabs of the South-pane. You can also View asset data details by choosing the Device name hyperlink.
South-pane
The South-pane uses the following tabs to display in-depth information about the device selected in the North-pane. Using the South-pane, you can view details about a device, add and edit checks and tasks, manage patches, and more.
| Tab | Feature | Description | OS |
|---|---|---|---|
| Summary | View the device summary | Device hardware details, Agent features, overall check status, IP address of last upload (if known) | Windows, macOS, Linux |
| Outages | View device outages | Information on Check failures and when the device was overdue or offline. | Windows, macOS, Linux |
| Checks | Proactive Monitoring | View Check Results and manage Checks | Windows, macOS, Linux |
| Notes | N-sight RMM Notes | View, Edit, Delete Notes | Windows, macOS, Linux |
| Tasks | Automated Tasks | Manage Automated Tasks and view their results | Windows, macOS |
| Assets | Asset Tracking | View the Device's Hardware and Software information | Windows, macOS, Linux |
| Patches | Patch Management | Manage Patches and view the results of the Patch Scan | Windows |
| Antivirus | Managed Antivirus | View discovered Threats, Scan results and Quarantine. Set Threat Policy and Quarantine Action. | Windows |
| Backup | Backup & Recovery | View the history of the backup jobs. Initiate backup and restore sessions | Windows |
| Web | Web Protection | View Day, Website and Category activity (options depend on account privacy settings) | Windows |
Related articles