
Feature and Functionality Settings Icons
We use icons in a feature or functionality Settings dialog to make it easier to spot if it is enabled or disabled at the entity level, and whether devices under an entity have the same settings.
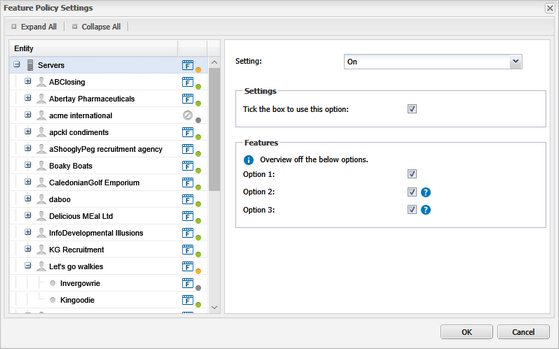
Feature or Functionality enabled for the entity
- Feature or Functionality icon - feature or functionality enabled for the entity type
- “No” icon - feature or functionality disabled for the entity type
Feature Status Indicators (Dots)
- Green (GN)—Feature or functionality enabled for all devices under that entity. This includes device level settings
- Grey (GY)—Feature or functionality disabled on at least one device under that entity. This includes device level settings
- Orange (OR)—One of the child entities has a different configuration to the parent. Where a Client only has one Site, its status indicator reflects that of the Site.
The following table shows example scenarios of the feature status indicators used on the Dashboard. It highlights the effects device-level configuration has on the indicators in the Policy Settings dialog.
| Entities | Scenario 1 | Scenario 2 | Scenario 3 | Scenario 4 | Scenario 5 | ||||||
|---|---|---|---|---|---|---|---|---|---|---|---|
| Feature State | Dots | Feature State | Dots | Feature State | Dots | Feature State | Dots | Feature State | Dots | ||
| Server 1 | On | GN | Off | GY | On | OR | Off | OR | On | OR | |
| Client 1 | Use Parent (On) | GN | Use Parent (Off) | GY | Use Parent (On) | OR | Off | OR | On | GY | |
| Site 1 | On | GN | Off | GY | Use Parent (On) | GY | Use Parent (Off) | GN | Off | GY | |
| Site 1 devices | Device101 | Use Policy Setting (On) | Use Policy Setting (Off) | On | On | Use Policy Setting (Off) | |||||
| Device102 | Use Policy Setting (On) | Off | Use Policy Setting (On) | On | Use Policy Setting (Off) | ||||||
| Device103 | On | Use Policy Setting (Off) | Off | On | Use Policy Setting (Off) | ||||||
| Site 2 | Use Parent (On) | GN | Use Parent (Off) | GY | Use Parent (On) | GN | Use Parent (Off) | GY | Feature not enabled | ||
| Site 2 devices | Device201 | Use Policy Setting (On) | Off | On | Use Policy Setting (Off) | ||||||
| Device202 | On | Use Policy Setting (Off) | On | Off | |||||||
| Device203 | On | Off | Use Policy Setting (On) | Off | |||||||
To view device specific feature settings.
Device Dialog
- Right-click on the device in the North-pane (or from the device type drop-down)
- Go to Edit < device type > in the context menu
- Navigate to the feature section
- Review the settings
User Audit Report
The User Audit Report can be used to identify configuration changes down to the device level.
- Go to Reports > User Audit Report
- Apply filters. Use Event and choose the feature policy settings entry (for example, Remote Background Policy Settings)
- Generate or CSV Export to create the report
- View the Details to see whether the feature was turned ON or OFF and at what level:
- Overall Device type: ON - Server : All
- Client configuration: ON - Workstation : Client (Dashboard name / Client name )
- Site configuration: ON - Workstation : Site (Dashboard name / Client name / Site name)
- Device configuration: ON - Workstation : Device (Dashboard name / Client name / Site name / Device name)
Loading the CSV Export into a spreadsheet program can make it easier to check the configuration settings.
Which features and functionality with a Settings dialog do you want to view now?
- Alerts (Windows, Mac or Linux)
- Backup & Recovery (includes Backup & Recovery Documents for Windows and Mac workstations and laptops)
- Managed Antivirus (Windows and Mac)
- Monitoring templates
- Network Discovery (Windows)
- Patch Management (Windows) (Managed PatchAutomated Task for Mac)
- Remote Background Manager (Windows)
- Risk Intelligence (Windows)
- System Tray Application (Windows)
- Network Discovery (Windows)
- Take Control (Windows or Mac)
- Web Protection (Windows)