
Assets view UI overview
Use the Assets view to monitor assets efficiently with filters, searches, and actions. Charts and tables help you track and locate assets quickly. You can drill down into each asset to review more details.
The view helps you identify patterns, trends, and anomalies so you can find opportunities, risks, and areas to improve. Although help desk technicians use the Assets view most often, anyone who needs to manage or locate assets can use it.
You can take several actions directly from the Assets view including rebooting an asset, starting a remote session, and running scripts. The system records every action you start in the Assets view in the User Audit Report, available from Reports > User Audit Report.
Charts in the Assets view
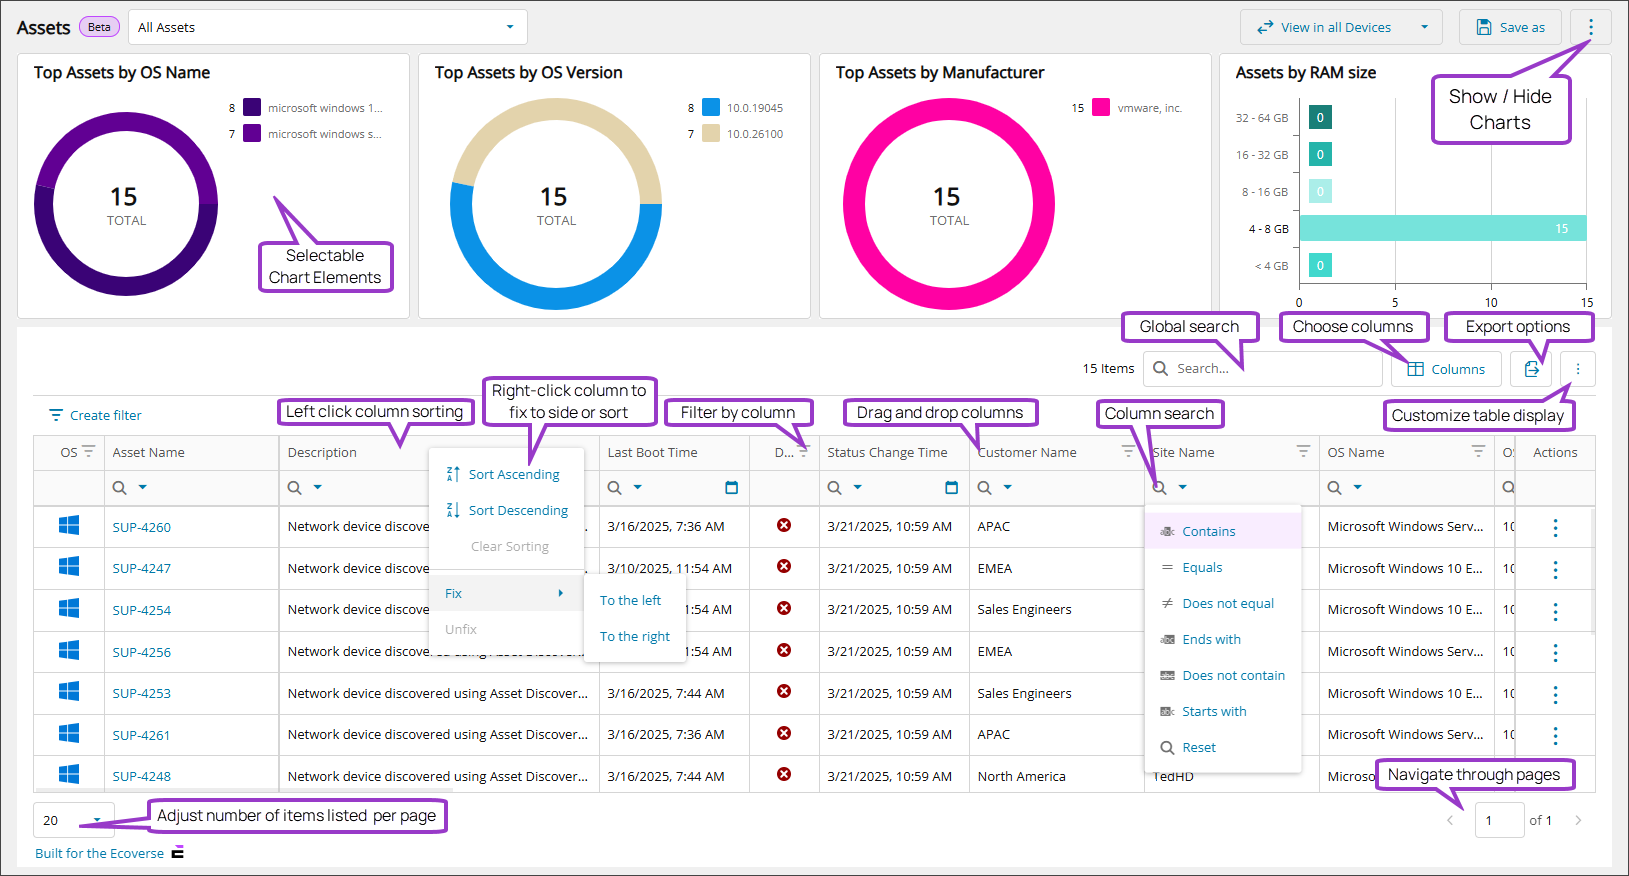
At the top of the Assets view, charts show graphical summaries of the asset data in the table. These charts update when you apply filters, helping you focus on specific asset types, system states, or other criteria.
Asset table and column options
Select which columns to display using the column chooser. This lets you customize the view, so you see only the information you need.
To view more information, select an asset to open the .
For the full list of table columns, see Data columns in the Assets view.
Access the Assets view
- Select Dashboards > Assets in the Left navigation.
Ecoverse functions
All new Ecoverse views support filtering, sorting, searching, and exporting.
Select a link below to view full instructions and details.
- Ecoverse views
- Filter and sort Ecoverse views
- Search Ecoverse views
- Create custom filters in Ecoverse views
- Custom filters examples
- Customize your Ecoverse views
- Save Ecoverse views
- Export data from Ecoverse views
Some Ecoverse views may not include all available functions at launch. As new views are developed, features like filtering, sorting, searching, and exporting may be added over time.
Related articles