Network Devices tab
After network devices have been set to be monitored, they appear in the Network Devices tab of the All Devices view.
Once monitoring is added to network devices, they appear in the Network Devices section of the All Devices view.
The North-pane displays the device details with the South-pane returning Checks and Summary information.
North-pane
The devices displayed in the North-pane are based on your current left pane Client and Site selection, with information (including its status) returned for each device.
To provide a more targeted view these devices may be filtered using Search Network Devices option or status drop-down: All Devices or only Problem Devices.
Icons indicate the device type and status (checks passed or failed, network offline or device unreachable) as well as operating system type. You can also hover over the device’s status icon for specific information on its current state.
| State |
|
|
|
|
|
|
|
|
|
|
|
|
|
|
|
|
|
|
|---|---|---|---|---|---|---|---|---|---|---|---|---|---|---|---|---|---|---|
| All Checks passed / device online |
|
|
|
|
|
|
|
|
|
|
|
|
|
|
|
|
|
|
| Network offline |
|
|
|
|
|
|
|
|
|
|
|
|
|
|
|
|
|
|
| 1(+) Check(s) failed / device is unreachable |
|
|
|
|
|
|
|
|
|
|
|
|
|
|
|
|
|
|
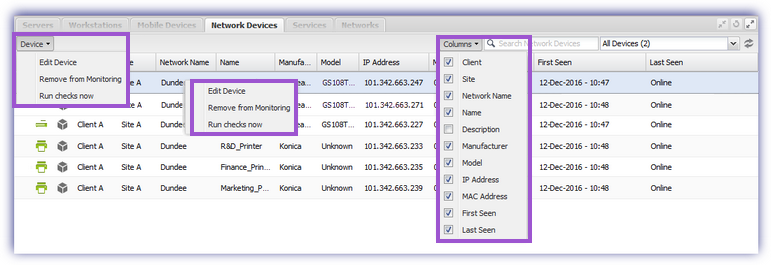
A customized view containing only information pertinent to you (Client, Site, Name, Manufacturer etc.) is configurable through the Columns drop-down.
Device context menu
The device context menu (available when right-clicking on the device or from the device drop-down) includes the options to view and Edit Device details, Remove from Monitoring, Run checks now and edit the device level Alert Routing Settings.
View and Edit device details
Information on the device, including device and network details, is retrieved through Network Discovery and reported in the Device Details dialog when double-clicking on a device in the North-pane.
To update the editable fields in this dialog, for example change the Device Name, Description or reclassify elements using the relevant drop-down menu options (set the operating system, etc.):
- Right-click the device in the North-pane, or highlight it and choose the Device drop-down menu.
- Select Edit Device.
- Amend the settings as needed.
- Choose OK to save and apply.
After you save the changes, the updated information not only appears against the device in the Network Devices tab but also in its Connected Devices entry in the Networks tab.
Run Checks Now
Available for currently online devices, this option runs the device's Checks when the command is received.
This option is not available when the device is offline, or when the device's checks are already running.
South-pane
The South-pane contains detailed information on the selected device.
Checks tab
The Checks tab lists all of the checks active on the device. This includes the status from the last time the check ran with additional details available in the More Information section.
Checks are managed from the appropriate drop-down. Add Check or Check (Edit or Delete) with the Edit and Delete also available from the check's right-click context menu.
Where a check is in the failed state it may be marked as cleared (acknowledged) using the tick box against the Check, select the clearing behavior then Save Changes.
Check Threshold
Depending on the Check type, it may include a configurable a threshold. Where the monitored component is selected but a threshold is not enabled, the Check operates in report only mode. The component is still monitored, but it will never report as failed.
A Check may be configured to have a mixture of monitored components with and without thresholds, and only those with thresholds will generate a failure. For example, in the Cartridge Level Check you could configure black with a threshold and all other colors without.
More Information
Click the link against the Check to display details for each item.
The Printer Checks (Cartridge and Paper Level) include the unit of measurement (Supply Unit) used by the SNMP component. The Maximum Capacity in Supply Units and the Current Level displayed both as a Supply Unit value and percentage, with a comparison against the threshold. If a threshold was not specified for the item, the message threshold disabled is displayed against Current Level.
The Interface Check (routers, firewalls and switches) includes the selected port Interface Type, its Admin Status, whether the interface is enabled for operation, and Operational Status, the running state of the interface. The ports Physical Address and the time of the Last Change. Where known the port speed is also displayed.
The Ping Check (all monitored devices) includes information on the Packet Loss and Average Round-Trip Time.
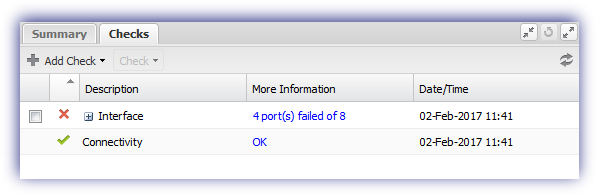
Check Failure Compact View
As a device can have multiple Checks, with each containing a large number of monitored components, where a Check is reported as failed we utilize a compact view to reduce their footprint in the South-pane and simplify problem identification.
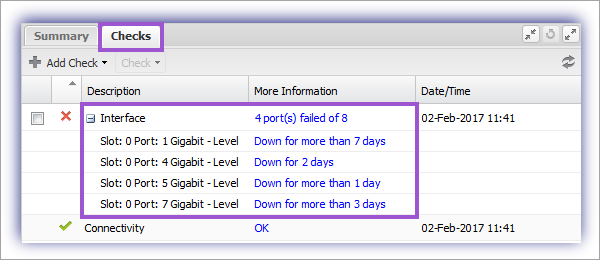
When compacted, the overall status is returned with more detail available by expanding the check from the plus button. Click the More Information link to open the dialog focused on the failing component.
Compact View and Expanded View
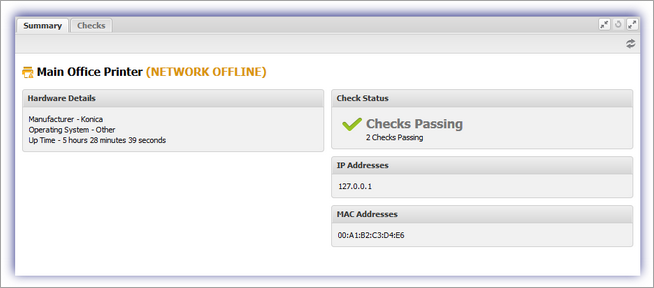
Summary tab
The Summary tab lists the selected device's Hardware Details, overall Check Status, and network information including the current Up Time and the device's IP Addresses and MAC Addresses.