
Wall Chart
The Wall Chart provides an at a glance overview of any server or workstation problems reported on the All Devices view.
To open the Wall Chart go to View > Wall Chart from the All Devices view or click Wall Chart in the Left navigation.
Wall Chart Information
The following details are displayed on the Wall Chart.
| Column | Content |
|---|---|
| Operating System |
Windows |
| Device Type |
Server
|
| Client, Site and Device name | Entity name |
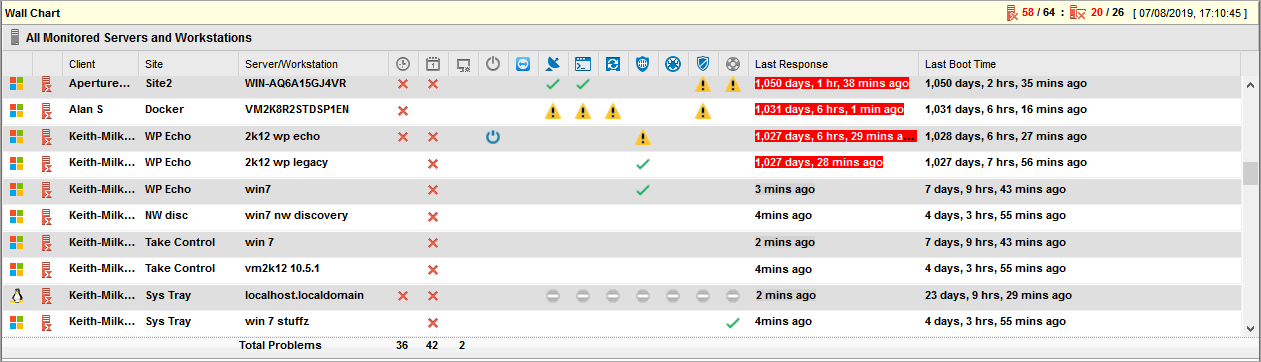
| Failed Check or Automated Task | Indicated by a red exclamation box under the appropriate icon, hovering over the icon to display the check name. The Total Problems for each check or Automated Task is reported at the bottom of the Wall Chart. |
| Overdue Server | Where a server has failed to report back to N-sight RMM the background of the Last Response is changed to red to highlight the server as overdue. |
| Offline | If a device has undergone a graceful shutdown it is reported as offline with a gray Last Response background. |
| Reboot | It may be necessary for the device to restart, for example to complete a patch remediation or as part of the Managed Antivirus installation, and this is indicated in the Reboot column. |
| Feature columns | The status of Take Control or Backup & Recovery - active, pending, failed or the feature is not available for the installed Agent version. |
| Last Response | When N-sight RMM last received data from the Agent. |
| Last Boot Time | The time since the machine last started. |
The overall number of servers and workstations experiencing problems against the monitored devices, any PSA errors as well as the time of the last Wall Chart update are displayed in the top right.
Wall Chart Indicator Behavior
Sound
To make the user aware of a Check failure on a device which was previously in the passed state a notification sound is played when a Check fails and the device appears on the Wall Chart. Where a Check fails on a device that is already on the Wall Chart a notification sound is not played.
Visual
Regardless of whether the device is already on the All Devices view, when the Check fails the device is highlighted against a bright pink background for the first interval - as an enhanced visual indicator that a problem has occurred - this background color then changes to a faded pink for the next 119 intervals and if the Check is still in the failed state at this point the background fades.
Ordering
To order the information contained in the Report simply click the appropriate column heading, but please note once the Wall Chart refreshes this ordering will be lost.
Configuration Options
There are various Wall Chart configuration options which are covered in the section: Change the Wall Chart Settings as well as the capability to launch a Take Control session directly from the Wall Chart.
Persistency
Any changes made to the column widths on the Wall Chart are retained and applied the next time you login.
Security
If you are using a dedicated N-sight RMM computer to display the Wallchart, for example on a wall-mounted monitor, we recommend you take the security precaution of creating a specific Wallchart user with limited permissions and IP restrictions enabled.
What do you want to do
- Create a user role and configure its permissions
- Add staff users and assign roles and client groups
- Edit users
- Configure IP address settings
- Review the User security options