
The All Devices view Networks tab gives you access to your Network Discovery data.
The Networks tab in the All Devices view provides access to your managed networks data. The interface is divided into two panes:
- North-pane: Displays all managed networks.
- South-pane: Displays detailed data for the selected network.
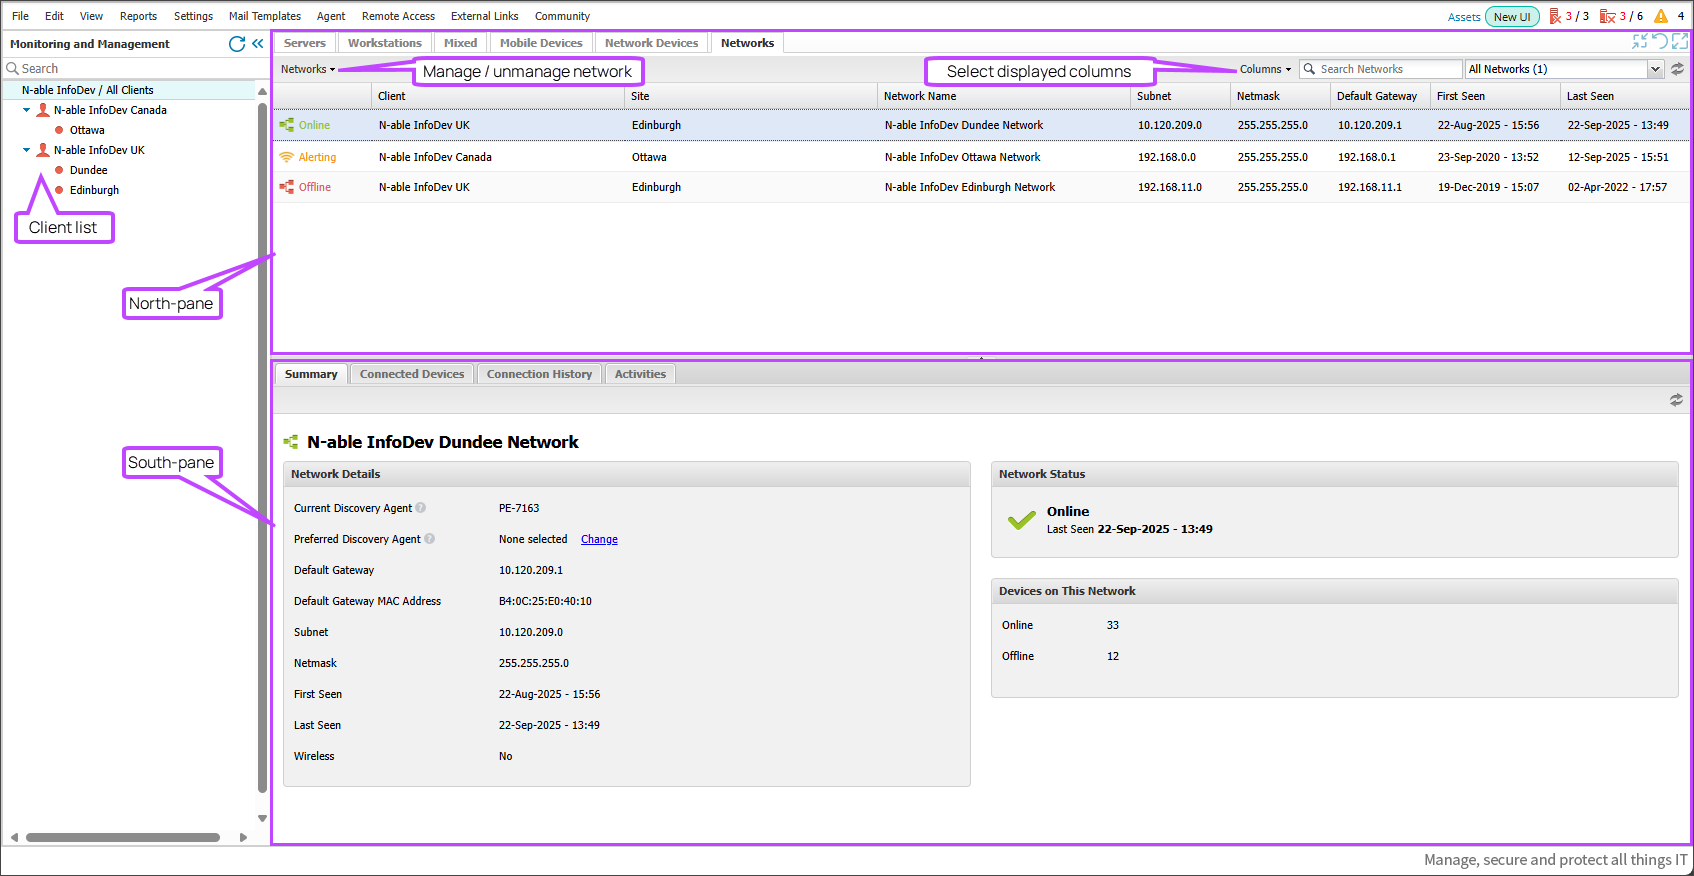
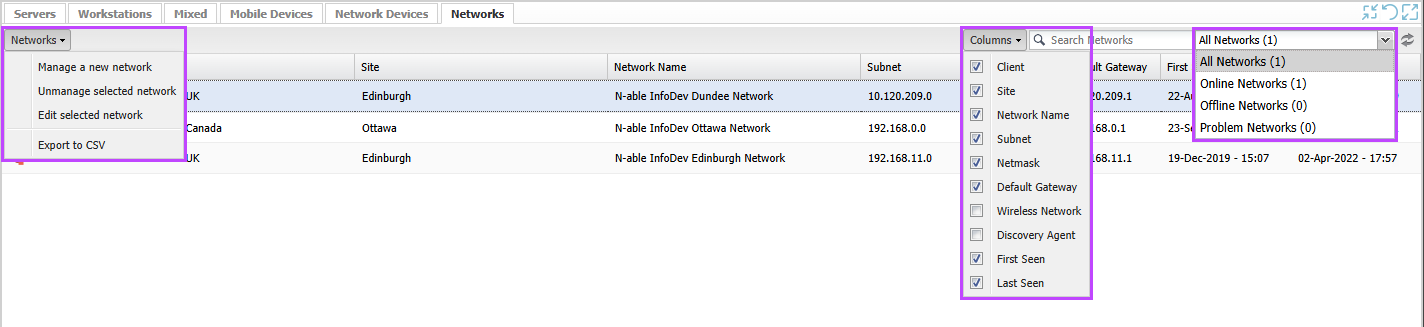
North-pane
The North-pane lists networks that have been brought under management. The list is filtered by the selected Client or Site. If no networks are managed, the list will be empty.
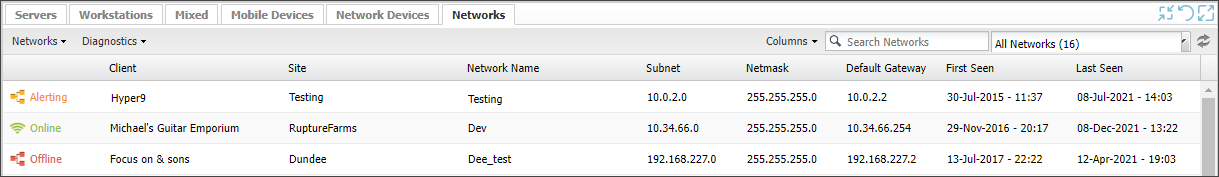
Each network appears on its own row and includes:
- Network type (wired or wireless)
- Status (Online, Offline, or Alerting)
- Client and Site
- Network name
- Subnet and netmask
- Default gateway
- First seen and last seen timestamps
You can perform the following actions in the Networks tab:
South-pane
The South-pane displays data based on the selected tab:
Summary tab
The Summary tab is divided into three sections:
- Network Details - displays various network attributes, such as Default Gateway, Subnet, etc.
- Network Status - shows the current status of the network.
- Devices on this network - provides an overview of the total number of connected devices.
Network Details
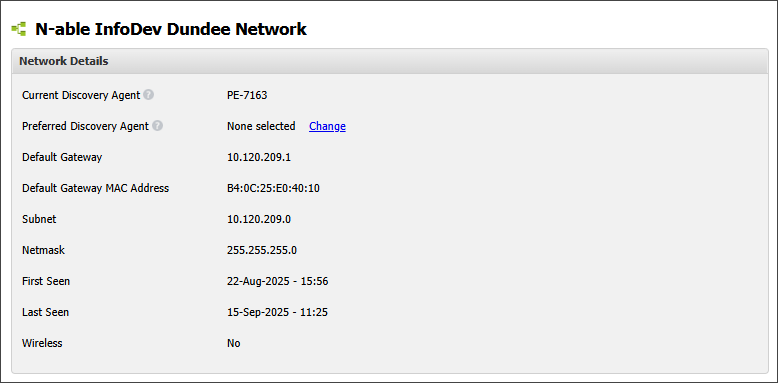
The Network Details section gives you an at-a-glance details of:
- Current Discovery Agent: The device currently scanning the network.
- Preferred Discovery Agent: The designated device for scanning. You can change this using the Change option. See Set the preferred Network Discovery Agent.
- Default Gateway: IP address of the network’s gateway. If Load Balancing Gateways are in use. please see Load Balancing Gateway considerations for recommended setup.
- Default Gateway MAC Address
- Subnet
- Netmask
- First Seen: Timestamp of first detection.
- Last Seen: Timestamp of last detection.
- Wireless: Indicates if the network is wireless.
- Wireless Network: Only shown when connected to a wireless network.
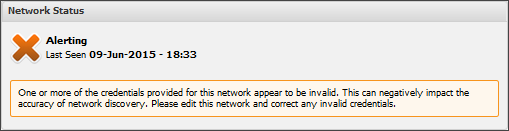
Network Status
Shows whether the network is Online, Offline or Alerting, along with the last seen timestamp.
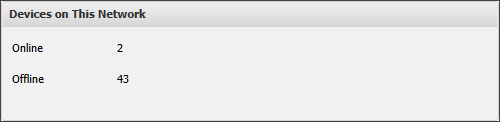
Devices on this Network
Displays the number of devices currently Online and Offline.
Connected Devices tab
After the initial scan, all online devices attached to the network are listed here.
You can:
- Edit a selected device.
- Bring a device under Network Device Monitoring.
- Export to CSV
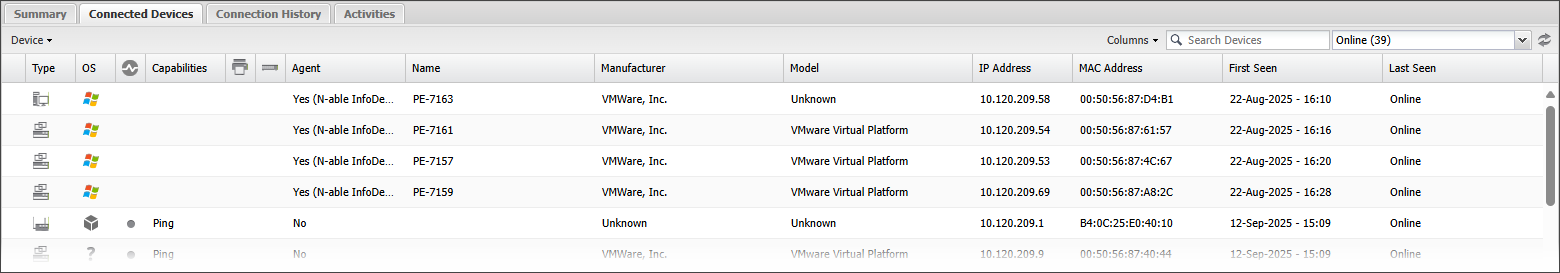
If a device type supports monitoring, it is interrogated via SNMP to confirm eligibility.
Device details include:
- Device type
- Operating System
- Agent
- Name
- Manufacturer
- Model
- IP Address
- MAC Address
- First Seen
- Last Seen
Devices with multiple NICs or MAC addresses are grouped together. Use the expand/collapse buttons to view individual details.
Connection History tab
The Connection History tab displays the recorded connection and disconnection events of devices on your managed network. Each entry provides the following details.
- Connection State: connected
 or disconnected
- Type: device type.
- Operating System: the OS running on the device.
- Device Name
- IP address
- MAC address
- Event Time
You can perform the following actions in the Connection History tab:
Activities tab
Shows actions such as Agent push installs and device promotions to Preferred Discovery Agent.
Hover over the Success or Failure icon to view details. For push installs, error messages may indicate issues such as login or firewall problems.
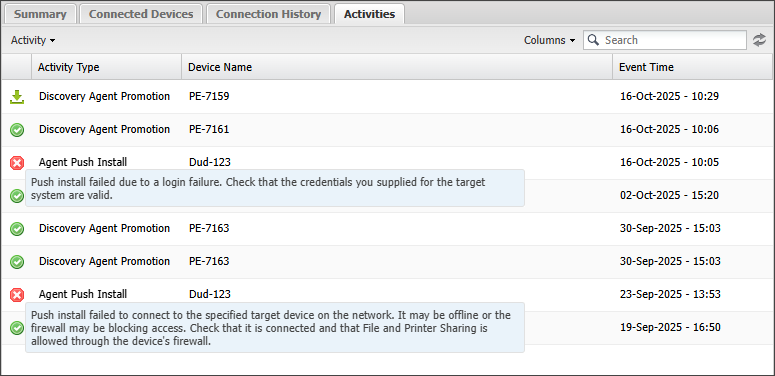
Table columns
Use the Columns menu to show or hide table columns. Some columns are fixed and cannot be customised.
Filters
Use the device status drop-down (e.g. Online, Offline) and the Search Devices field to filter results. Partial string matches are supported by the search.
Export to CSV
You can export data from both the North and South panes using the Export to CSV option in the drop-down menus.
The exported data reflects your current filters and selected columns.
Related articles