
Active Issues
The Active Issues view shows all monitored assets that are not in a normal state for the clients and sites you monitor. It enables you to efficiently identify and respond to issues using filters, searches, and actions. This view is designed mainly for help desk technicians, but it can be viewed by other users who need to search for or monitor issues.
Active issues are problem checks that have one of the following statuses:
- Failing: The check is in a failed state.
- Soft Failure: The check is in a failed state but has not exceeded its failure notification threshold.
- Cleared: The failed check is marked as acknowledged.
To access the Active Issues view, you need a user role with N-sight Monitoring & Management permisisons. If you access the view but cannot view any information, contact your organization's N-sight RMM administrator.
Visualize data
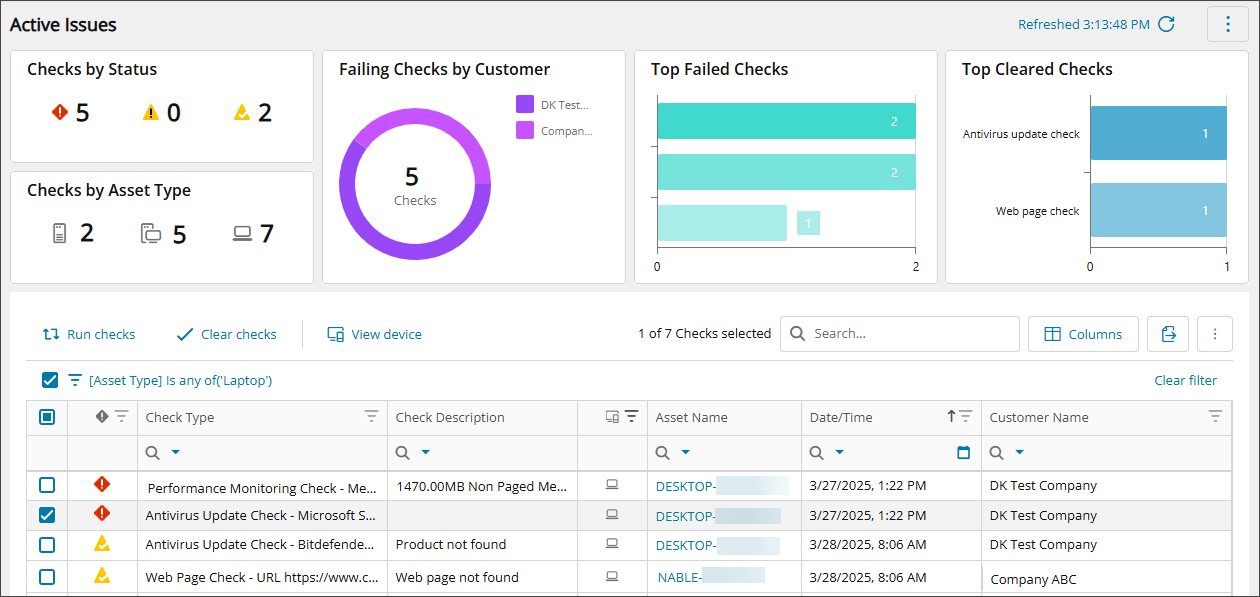
The Active Issues view includes visual representations of your active issues data in charts at the top of the view. The charts help you view multiple metrics at one time helping you spot patterns and trends with your active issues. At one glance you can see high level data such as checks by status or asset type, checks by customer, or your top failing or cleared checks. You can also select one or more chart elements to quickly filter the data table below. For instructions, see Filter using the charts.
Filter or sort data
In addition to filtering by chart elements, the Active Issues view enables you to filter the table by columns, and by date and time, or a combination of both. Or you can sort the columns in ascending or descending order. For example, you could filter the table to show all failing Antivirus update checks on a particular date and then sort the table by client in alphabetical order. For instructions, see Filter and sort Ecoverse views.
You can also build more advanced filters to drill down into the data, making it easier to focus on specific information. When you select the Create filter option, you set conditions or rules using groups of conditions to pinpoint specific data. For instructions, see Create custom filters in Ecoverse views.
Search data
You can search the Active Issues table with a general search of all columns or using a column search. The general search using the search box at the top of the table is helpful when you're not sure where the data is in the table. A column search lets you focus on one ore more columns when you already know where to look.
You can make your column searches even more powerful by using operators to refine your search results. Operators such as Contains, Starts with, and Ends with let you fine-tune your searches within a column, helping you find exactly what you need.
For search instructions, see Search Ecoverse views.
Customize your Active Issues view
Customizing your Active Issues view can help you organize your work and focus on items that need your attention, making your daily work more efficient. In addition to filtering and searching to narrow down table data, you can also customize the view for your preferences. You can hide or show the charts, choose the columns you want displayed, re-size the columns and set the order they show in the table. You can even customize the size and look of the table rows.
The last settings and customizations you use in the Active Issues view are present the next time you open the view, but you can clear and reset those preferences as well.
For instructions, see Customize your Ecoverse views.
Actions available from the Active Issues view
After you identify the active issues you are looking for, you can take action directly from the Active Issues view with the following tasks:
- Run problem checks again. See Rerun failed checks.
- Clear problem checks after investigation or if it's a know issue. See Clear checks using the Active Issues view.
- View device information in the All Devices view for a problem check. See View an asset with active issues in the All Devices view.
- Export active issues data to EXCEL, PDF, or CSV. See Export data from Ecoverse views.
All user actions initiated from the Active Issues view are recorded in the User Audit Report, available from Reports > User Audit Report.
Related articles