
Protection Effectiveness
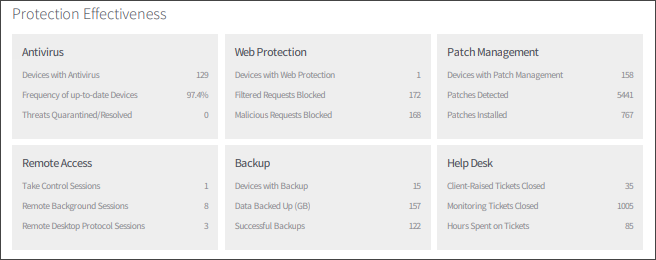
Protection Effectiveness shows how key indicators performed during the selected month.
Where device counts form part of the report, devices must meet the following criteria to be included in the Executive Summary Report:
- The device had at least one qualifying <feature> check that ran during the reporting period (e.g., SentinelOne Script Check for Antivirus).
- The device was online and synchronized (i.e. offline or unsynchronized devices are excluded).
Antivirus
- Devices with Antivirus: Total number of devices with a qualifying Antivirus check that ran during the reporting period (SentinelOne Script check, Managed Antivirus check, or Antivirus Update check).
- Frequency of up-to-date Devices: Total number of times the Antivirus Update Checks were reported as up-to-date across all Servers and Workstations where the Check was configured (all products).
- Threats Quarantined / Resolved: Total number of threats quarantined and resolved (Managed Antivirus only).
Web Protection
- Devices with Web Protection: Total number of devices running Web Protection.
- Filtered Requests Blocked: Total number of web requests blocked based on the selected filtering categories.
- Malicious Requests Blocked: Total number of web requests blocked as malicious.
Patch Management
- Devices with Patch Management: Total number of devices with the Patch Status Check that ran during the reporting period.
- Patches Detected: Total number of missing patches detected, not including patches set to Ignored.
- Patches Installed: Total number of patches installed.
Totals may differ from the All Devices view and Patch Overview Reports because patch detection and installation may span multiple months, not only the month specified in an Executive Summary Report.
Remote Access
- Take Control Sessions: Total number of Take Control sessions.
- Remote Background Sessions: Total number of Remote Background sessions.
- Remote Desktop Protocol Sessions: Total number of Remote Desktop Protocol sessions.
Backup
- Devices with Backup: Total number of devices with the Backup Check (all products).
- Data Backed Up (GB): Volume of data backed up. This information is only available for Backup & Recovery.
- Successful Backups: Total number of successful Backup Checks (all products).
Help Desk
- Client-Raised Tickets Closed: Total number of tickets raised by the client and marked as closed. This information is only available for Service Desk.
- Monitoring Tickets Closed: Total number of monitoring tickets raised and closed. This information is only available for Service Desk.
- Hours Spent on Tickets: Total amount of time allocated against tickets. This information is only available for Service Desk.
Risk Intelligence
- Devices with Risk Intelligence: Total number of devices running Risk Intelligence scans.
- Total Liability Amount: Total liability amount of all Risk Intelligence devices under management.
What do you want to do?