
Unmonitored Devices
Where configured, Network Discovery queries the specified networks for details of devices attached to the network then reports the information in the All Devices view South-pane Networks tab. The Networks tab lists the discovered network Connected Devices and their monitoring state.
In addition to the Networks tab, you can use the Unmonitored Devices view to identify discovered devices not currently under monitoring, filtered by Device, Operating System and Manufacturer. You can then select the device and place it under monitoring from the All Devices view.
Prerequisite
Discovery Agents must be installed on the network and Network Discovery enabled.
Unmonitored Devices
To open the Unmonitored Devices view:
- In N-sight RMM, click the Dashboards menu icon
 in the left navigation
 - Select Unmonitored Devices from the drop-down
Access to the Unmonitored Devices view requires the Monitoring & Management Networks Permissions.
The Unmonitored Devices view is Client Group aware. It only displays those Clients, Sites and Devices assigned to the user.
Unmonitored Devices Layout
The filter selection is retained when Unmonitored Devices refreshes.
The Unmonitored Devices view consists of two panes.
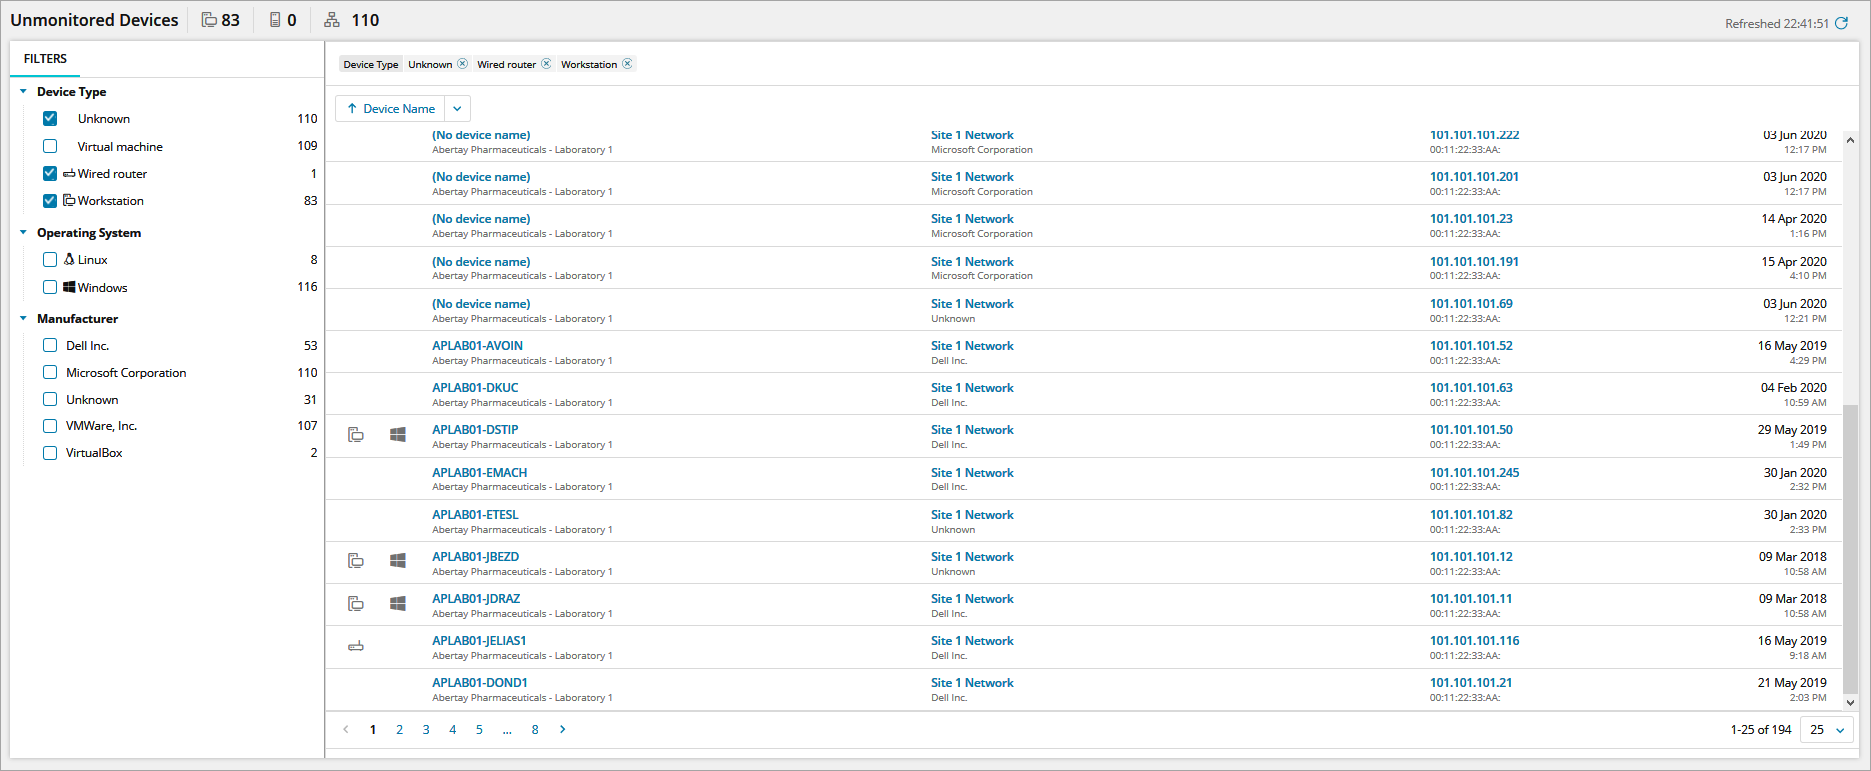
- Left filter pane — Allows you to filter by any combination of Device Type, Operating System or Manufacturer. In addition to the Filters pane, the main pane banner displays this selection with the option to close filters.
The left pane Filters reflect only those Unmonitored Devices discovered on the network. For example, if all Servers have an Agent, Servers are not available as a filter option.
-
Main pane — Lists all Devices that match the selected filter criteria. The information is split into five columns and populated if known:
- Device type
- Operating system
- Device name and associated Client and Site
- Network name, includes the device manufacturer
- IP and MAC address
- Date and time the device was first seen by Network Discovery
By default, the Main pane sorts by Device Name with the option to use the drop-down to select alternative sort criteria.
Navigate through the main pane and review the Unmonitored Devices. Select a device in the main pane then click on View Device to open the Networks Connected Devices South-pane section focused on the device.
Right-click on the device and select the monitoring action.
For Network Devices choose Monitor Device and for Windows and Mac computers opt to Push Monitoring Agent to Device.
The Connected Devices monitor actions are only available on supported devices that are currently online.
Alternatively for servers and workstation, there is the option to install the Agent manually on Unmonitored Devices.