
BrightGauge
|
"BrightGauge is an online Custom Reporting and Customer Portal tool for the Managed Services Industry!" From BrightGauge |
BrightGauge uses the Data Extraction API to pull the required information from N-sight RMM into their system. There are three steps to get the integration up and running.
This N-sight RMM integration was created and is maintained by BrightGauge. As such we recommend you contact BrightGauge directly in the event of any problems either in its initial implementation or subsequent usage.
1. Generate the API Key
To create the N-sight RMM API Token used by BrightGauge for communication.
The API Key is used to authenticate against the Public API. If you regenerate a new key, anything that uses the existing key to authenticate against the Public API will stop working. If you already have an API Key, we recommend you use it.
- Log in to N-sight RMM as a Superuser or (non-Classic) Administrator level access, or using a login with the required General permissions enabled, or using the Agent Key (if enabled).
- In the All Devices view, go to Settings > General Settings > API.
- Select Generate (or Regenerate when you are creating a new API Key) and record the API Key for future use.
You can generate the API Key as often as required. Each regeneration overwrites the existing key.
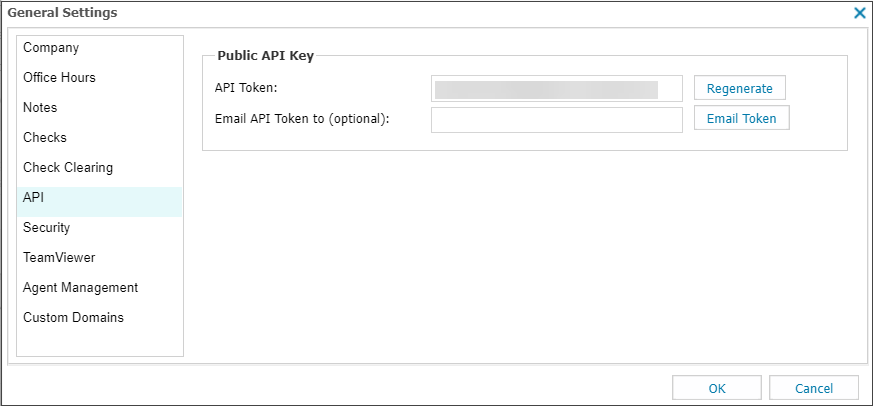
- Enter the recipient email address in the Email API Token to (optional) field and click Email Token (Optional).
The sent email includes the API Key and the server URL to query.
- Select OK to apply.
The database server to query is dependent on the territory your account is registered under. The current territories and their URLs are:
| Territory | URL |
|---|---|
| Americas | https://www.am.remote.management/ |
| Asia | https://wwwasia.system-monitor.com/ |
| Australia | https://www.system-monitor.com/ |
| Europe | https://wwweurope1.systemmonitor.eu.com/ |
| France (FR) | https://wwwfrance.systemmonitor.eu.com/ |
| France1 | https://wwwfrance1.systemmonitor.eu.com/ |
| Germany | https://wwwgermany1.systemmonitor.eu.com/ |
| Ireland | https://wwwireland.systemmonitor.eu.com/ |
| Poland | https://wwwpoland1.systemmonitor.eu.com/ |
| United Kingdom | https://www.systemmonitor.co.uk/ |
| United States | https://www.systemmonitor.us/ |
For example, a user in the United Kingdom uses the server URL: https://www.systemmonitor.co.uk/
Determine API Server URL from N-sight RMM URL
If you are unsure of your N-sight RMM account territory:
- Look at the URL you use to access N-sight RMM as it may include a region reference, or
- If the URL does not mention a region, for example a custom domain, append /dashboard to one of above URLs and attempt login to your N-sight RMM at the prompt. Based on the United Kingdom this would look like: https://www.systemmonitor.co.uk/dashboard
- If you cannot determine the region from a custom N-sight RMM URL. Open a command prompt or terminal on the device and perform an nslookup on the custom N-sight RMM URL:
nslookup dashboard.custom.domain
...
Non-authoritative answer:
Name:    dashboard.systemmonitor.co.uk
...
2. Select the integration in BrightGauge
-
Login in to your BrightGauge Account.
-
Add the Datasource:
New Account
From the account Overview page click on Add a Datasource.
Existing Account
Click on the Data menu at the top right corner of the screen, and select Datasources from the drop-down.
-
Navigate to the N-able RMM icon under All or in the RMM section of the "Add a new Datasource" section.
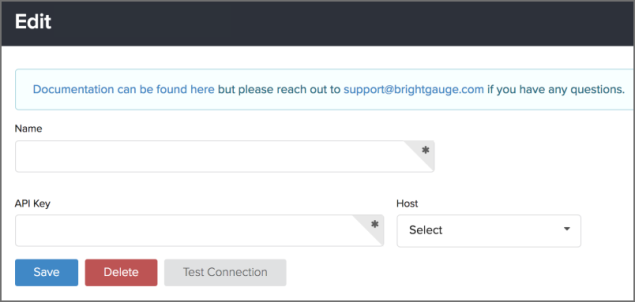
3. Configure the Datasource
-
Enter an identification Name for the datasource.
-
Enter your RMM API Key.
-
Select your Host territory from the drop-down. For example, www.systemmonitor.co.uk if registered on the UK All Devices view.
-
When complete, Test Connection and where the "Test succeeded" Save the settings.
Dashboards, reports, datasets, and gauges are automatically added to your account after the datasource is saved. They will start syncing immediately and will typically take 20-30 minutes to complete depending on the amount of transferred data.
Dashboards and reports
The integration's default dashboard is "Machine Monitoring" with the default "N-able RMM Executive Summary Report".
Datasets
-
Antivirus Statistics - Antivirus information for monitored workstations and servers. Devices in a status of deviceoverdue, failinactive, clearedinactive, or cleared are not shown
-
Application Data - Information on the software installed on the monitored devices.
-
Backup Statistics - Backup information where the backup status is not deviceoverdue, failinactive, clearedinactive, or cleared
-
Disk Statistics - Information on the disk drives of monitored devices
-
Machine Statistics - Machine information for monitored workstations and servers
-
Machine Stats Lite - A fast refreshing dataset pulling in information for monitored workstations and servers
-
Managed Antivirus Statistics - Antivirus information for machines under management
-
Patch List - Lists all software patches for monitored devices
-
Performance History - Memory and CPU information trending for the last 8 days for monitored devices
-
Server Outages - Information on Server Outage checks from the last 120 days
Only devices running the required features or checks are reported in the Dataset.
Visit the Gauges section of BrightGauge for a list of all default gauges. Sort by the Datasource and select for Default.
Further information on the integration is available from BrightGauge
Please be aware that we are not responsible for the content of external sites.