
Bandwidth Monitoring Check
Understanding how network bandwidth is used is essential for optimizing network design and planning future development. Bandwidth Monitoring helps you track usage across any physical (Ethernet, Fast Ethernet, or Gigabit Ethernet) or virtual network interface on SNMP-managed devices such as switches, routers, printers, or servers with SNMP software installed.
Use Bandwidth Monitoring to identify network bottlenecks and bandwidth-heavy devices. Resolving these issues can improve service quality by reducing response times and aligning hardware and bandwidth provisioning with actual needs. In some cases, this may also present opportunities to recommend new hardware or increased bandwidth.
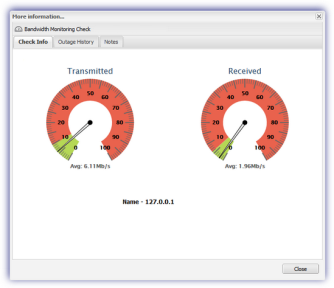
The Agent queries the SNMP-managed device every five minutes. It averages the volume of transmitted and received data over the last 15 minutes and displays the results in the All Devices view. If the data volume exceeds the threshold set in the Agent, an alert is triggered.
Failures in Bandwidth Monitoring checks appear in the All Devices view North-pane under the ![]() performance monitoring icon. Details about the failed check are shown in the lower pane.
performance monitoring icon. Details about the failed check are shown in the lower pane.
You can review historical data in the Performance and Bandwidth Monitoring History Report. This report shows results for the last 24 hours and the last 8 days.
You can suppress alerts until the number of consecutive check failures reaches the configured threshold. For details, see Configure alert thresholds to suppress alerts.
For usage techniques, refer to Bandwidth Monitoring Strategies.
To configure the check, see How to get Bandwidth Monitoring up and running.