Bandwidth and Performance Monitoring History Report
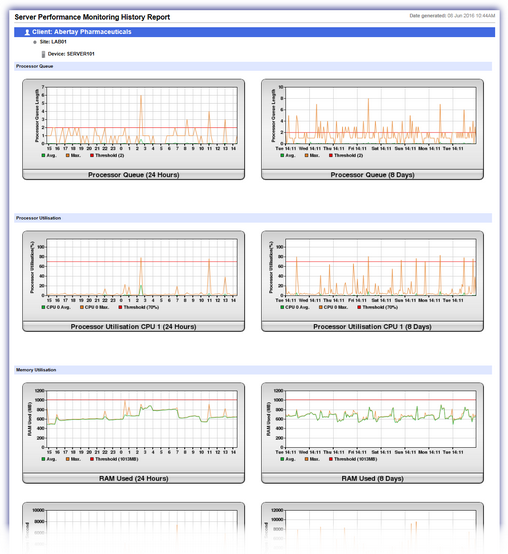
The Performance and Bandwidth Monitoring History reports show the results of Performance Monitoring checks and Bandwidth Monitoring checks for an individual device, over the last 24 hours and over the last 8 days.
Bandwidth Monitoring checks apply to servers only.
The charts for each check show the average and maximum values with the configured threshold to help you easily identify when and where performance bottlenecks occur on the server.
If a graph displays blank, it means we do not have data for that time period.
You can open the report from the Reports menu and the More Information section for the check.
Open the report from the Reports menu
- Go to Reports > Bandwidth and Performance Monitoring History Report.
- Choose the target Client, Site and Device from the corresponding drop-down boxes.
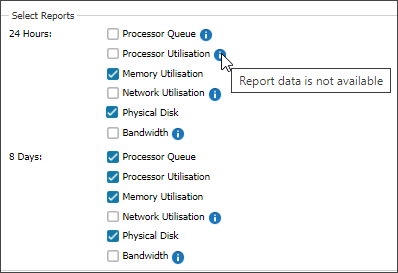
- Select the checkbox(es) for the data you want to include in the report for the last 24 hours and the last 8 days. If a data type is not available for the device, you cannot select that data and it is indicated with the information icon.
- Select OK to generate the report.
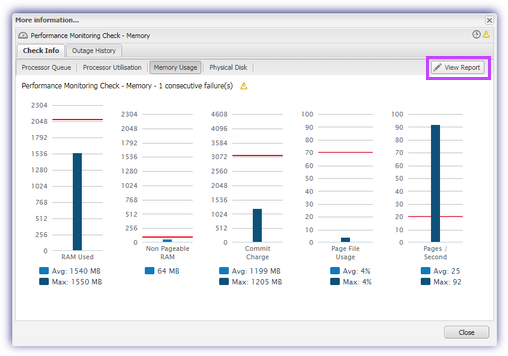
Open the report from the More information section for a check
- In the All Devices view North-pane, select the device.
- On the South-pane, go to Checks tab.
- Click the More Information link for a Performance Monitoring check or Bandwidth Monitoring check.
- Select View Report.
- Select the checkbox(es) for the data you want to include in the report for the last 24 hours and the last 8 days. If a data type is not available for the device, you cannot select that data and it is indicated with the information icon.
- Select OK to generate the report.
Example report