How to get Bandwidth Monitoring up and running
Generate an Alert where the throughput on the monitored SNMP enabled device exceeds the specified threshold, which is available as Mbits/sec (Megabits per second) or Kbits/sec (Kilobits per second).
Check configuration
Add
- In the All Devices view North-pane, select the device
- Go to the Checks tab
- Click Add Check
- Choose Add 247 > Bandwidth Monitoring Check
- Configure settings
- To run an Automated Task when the Check fails choose Assign a Task after creating the Check
- OK to save and apply
- Where Assign a Task after creating the Check is selected:
- Select the script
- Click Next to configure
- Enter the Command Line parameters (if required)
- Set a Script timeout in the range 1 - 3600 seconds (default 120 seconds)
- Click Finish to save and apply
Edit
- In the All Devices view North-pane, select the device
- Go to the Checks tab
- Select the target Bandwidth Monitoring Check
- From the Check drop-down
- Click Edit Check (also available from the Check's right-click menu)
- Configure the settings
- Click OK to save and apply
Delete
- In the All Devices view North-pane, select the device
- Go to the Checks tab
- Select the target Bandwidth Monitoring Check
- From the Check drop-down
- Click Delete Check (also available from the Check's right-click menu)
- Review the summary and select OK to confirm removal
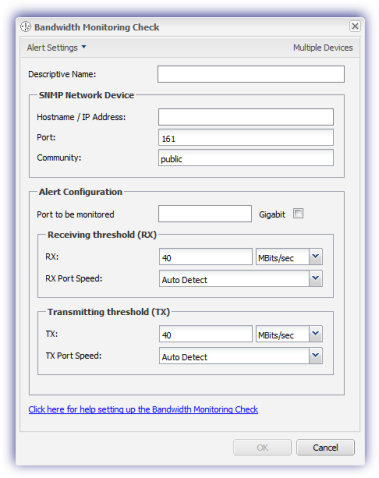
Bandwidth Monitoring Check Settings
Description
Enter a Description to identify the check.
Hostname / IP Address
Populate the Hostname / IP Address of the SNMP managed device to be monitored.
Where the SNMP managed device not be listening for SNMP queries on port 161 or if the community string is not public then change these values appropriately.
The Port number and Community string are case sensitive. As such please ensure that they precisely match the configuration on the SNMP managed device as any variance may result in an SNMP failure message.
Once the target SNMP Network Device's settings are in place click the Lookup button to see all of the ports that can be monitored on this device, along with the port speed where available.
Port to be monitored
Select the required port from the Port to be monitored drop-down menu.
When configuring the check via the All Devices view the Lookup option is not available. Simply enter the Port to be monitored and whether it is a Gigabit port*.
Actual port numbers on the SNMP managed device may differ from the labels associated with the physical ports on the exterior casing of the device (for example: physical port labeled, 1, may actually be port 101 and shown as #101 RMON Fast Ethernet Port 1 on Unit 1: 100Mbps).
Data Thresholds
After selecting the port enter appropriate thresholds for data received (Rx) and transmitted (Tx) above which an alert is to be generated.
The port speeds can be left as Auto Detect to use the speed of the monitored port as configured on the SNMP managed device. Alternatively, if the device connected to the monitored port (for example an ADSL router) is transmitting / receiving data at lower speeds than that configured on the SNMP managed device then the port speeds can be manually set in the appropriate Port Speed box.
The default units for the thresholds and port speeds are Mbits/sec (Megabits per second), but can be changed to Kbits/sec (Kilobits per second) with 9999 maximum value that can be entered for either.
*Gigabit port: by default the Bandwidth Monitoring Check uses 32-bit counters to retrieve the bandwidth information, although these may not provide enough capacity and wrap too quickly on high-speed interfaces. As such we have included the option to select Gigabit which forces the Agent to use 64-bit counters which are designed for high-speed interfaces (where supported on the device).
The counters are referenced in RFC 2233 which states that:
- For interfaces that operate at 20,000,000 (20 million) bits per second or less, 32-bit byte and packet counters MUST be used.
- For interfaces that operate faster than 20,000,000 bits/second, and slower than 650,000,000 bits/second, 32-bit packet counters MUST be used and 64-bit octet counters MUST be used.
- For interfaces that operate at 650,000,000 bits/second or faster, 64-bit packet counters AND 64-bit octet counters MUST be used.
The Bandwidth Monitoring Check and the SNMP Check use parallel queries to query and retrieve the SNMP GET OID information.
You can configure the SNMP timeout period - as used by the Bandwidth Monitoring Check - per device.
Information on both of the above changes, including resetting the Parallel SNMP behavior, is available in the following section: Parallel SNMP Queries and set the SNMP Timeout value