Overview dashboard
The Overview dashboard provides an at-a-glance overview of the system to enable monitoring. Breaking down device performance and information into easily digestible sections. Using the Overview dashboard , you can quickly determine the overall status of the system.
To open the Overview dashboard:
- In N-sight RMM, click the Dashboards menu icon
 in the left navigation
 - Select Overview from the drop-down
The Overview dashboard is Client Group aware. It only displays the Clients, Sites and Devices assigned to the user.
Overview dashboard layout
The Overview dashboard displays performance and information indicators in separate Overview dashboard charts.
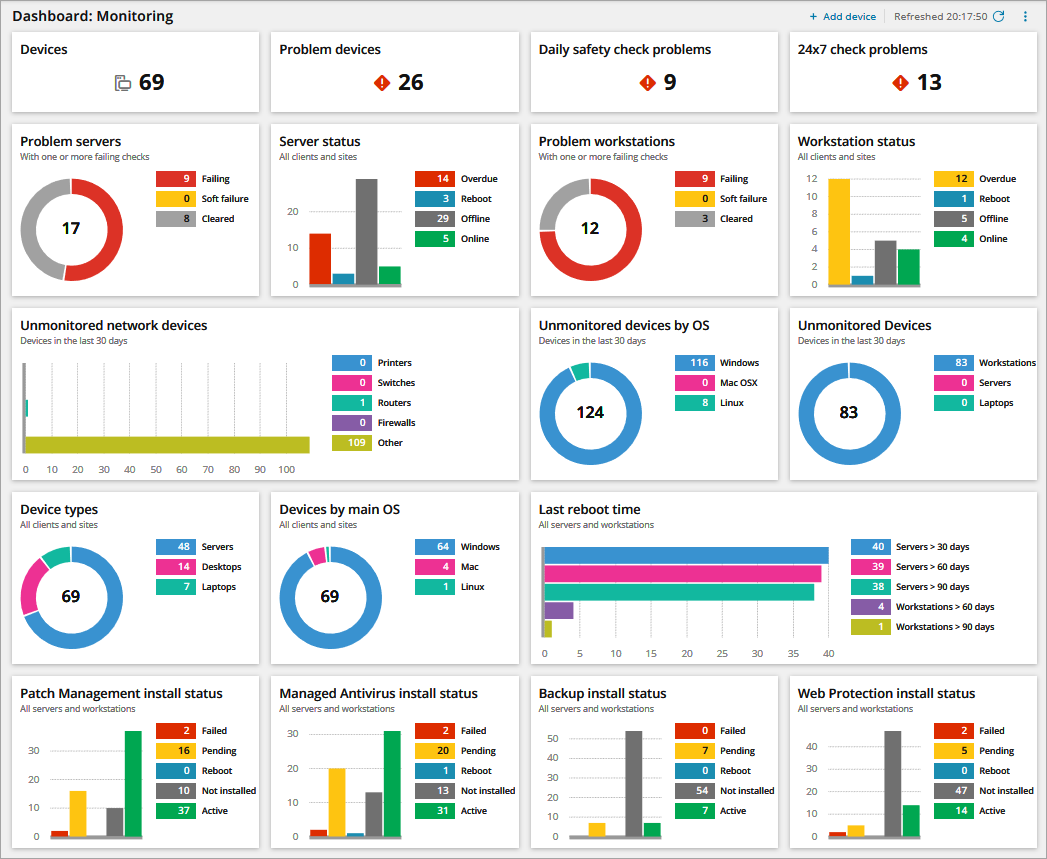
To drill down to review the chart information, click an indicator in the chart to open the All Devices view or Unmonitored Devices filtered on that data.
For example, if you click the Daily Safety Check Problems value, since it applies to both servers and workstations, the All Devices view opens at the Mixed tab with the Daily Safety Check Problems filter applied.
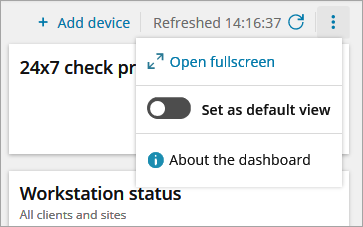
Expand to full screen
You can display the Overview dashboard on a large screen and you can view it in full screen width.
- Click the three settings button in the top right
- Choose Open fullscreen
- Click Exit fullscreen to return to the standard view
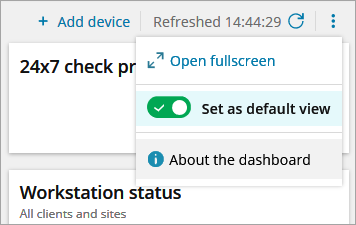
Set the Overview dashboard as the default view
Individual users can set the Overview dashboard as their default view when they open N-sight RMM.
If Set as default view is enabled, the Overview dashboard is the first item in the left navigation. If Set as default view is disabled or not configured, the Overview dashboard is the second item in the left navigation.
- Click the three settings button in the top right
- Click Set as default view, this action is confirmed with a tick icon and green button background
- To return to the default behavior, click Set as default view. This action is confirmed with a gray button background