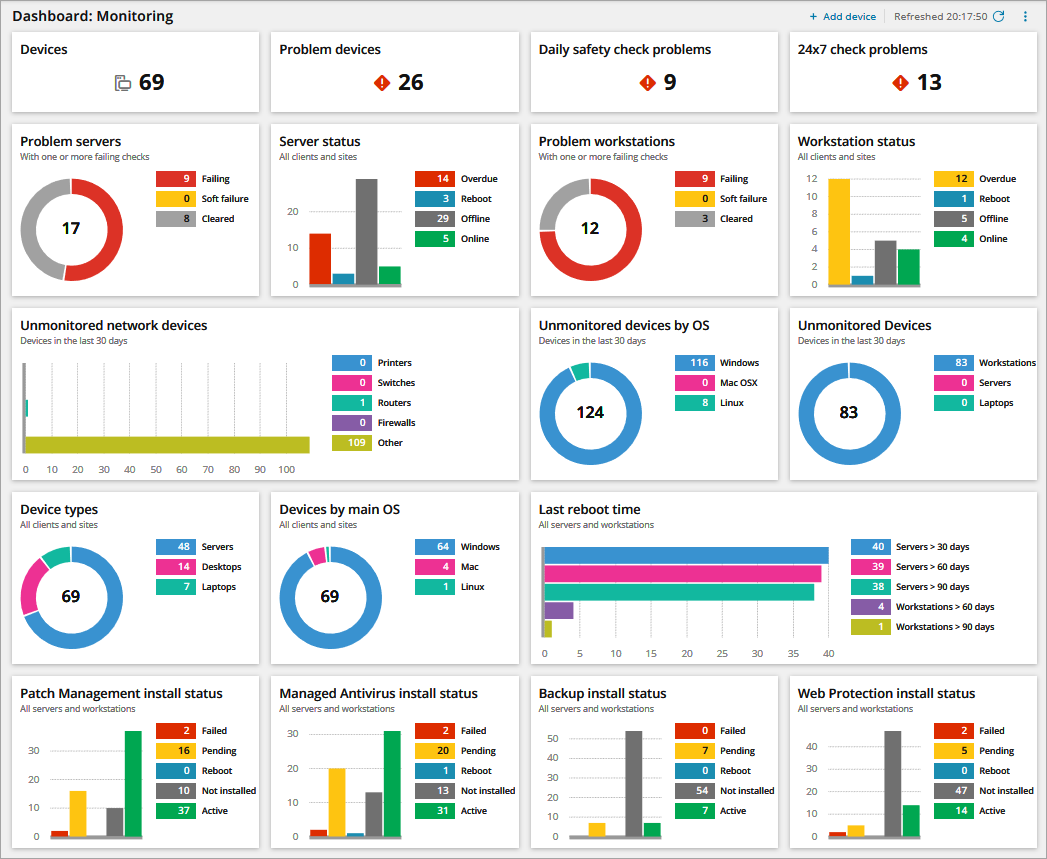
Overview dashboard charts
The Overview dashboard charts indicate the current status for the indicator. This information covers all Clients, Sites and Computers.
| Chart | Description |
|---|---|
| Devices | All monitored devices. |
| Problem Devices | All monitored devices experiencing at least one problem. |
| Daily Safety Check Problems | All monitored devices with at least one Daily Safety Check problem. |
| 24x7 Check Problems | All monitored devices with at least one 24x7 Check problem. |
| Problem Servers | All Windows and Linux servers with one or more failed 24x7 or Daily Safety Checks. |
| Server Status | The overall state of all Windows and Linux servers. |
| Problem Workstations | All Windows and Mac workstations with one or more failed 24x7 or Daily Safety Checks
. Statuses:
|
| Workstations Status | The overall state of all Windows and Mac workstations
. Statuses:
|
| Unmonitored Network Devices | The number of network devices discovered over the last 30-days not currently under monitoring grouped by network device type |
| Unmonitored Devices by OS | The number of computers discovered over the last 30-days not currently under monitoring grouped by Operating System |
| Unmonitored Devices | The number of computers discovered over the last 30-days not currently under monitoring grouped by device type |
| Device Types | All monitored devices categorized by type |
| Device by main OS | All monitored devices categorized by their main Operating System |
| Last Reboot Time | Last restart timeframe for all monitored devices. Categorized by type, each timeframe covers 30-days |
| Patch Management Install Status | The installation status of Patch Management across all supported devices |
| Managed Antivirus Install Status | The installation status of Managed Antivirus across all supported devices |
| Backup Install Status | The installation status of Backup & Recovery across all supported devices |
| Web Protection Install Status | The installation status of Web Protection across all supported devices
Statuses:
|

