
Debug Policy
The Automation Manager's Debug option is similar to the Run command. But, where Run executes the script in real time, Debug executes the script one object at a time. This slower pace allows for script review and troubleshooting.
To debug a policy...
- Launch Automation Manager
- Open the policy
- Click Open Policy File in the North-pane (available when Automation Manager launches), or
- Go to File > Open, or
- Click the Open button in the toolbar
- Navigate and select the target policy to open it in the north Policy Builder pane.
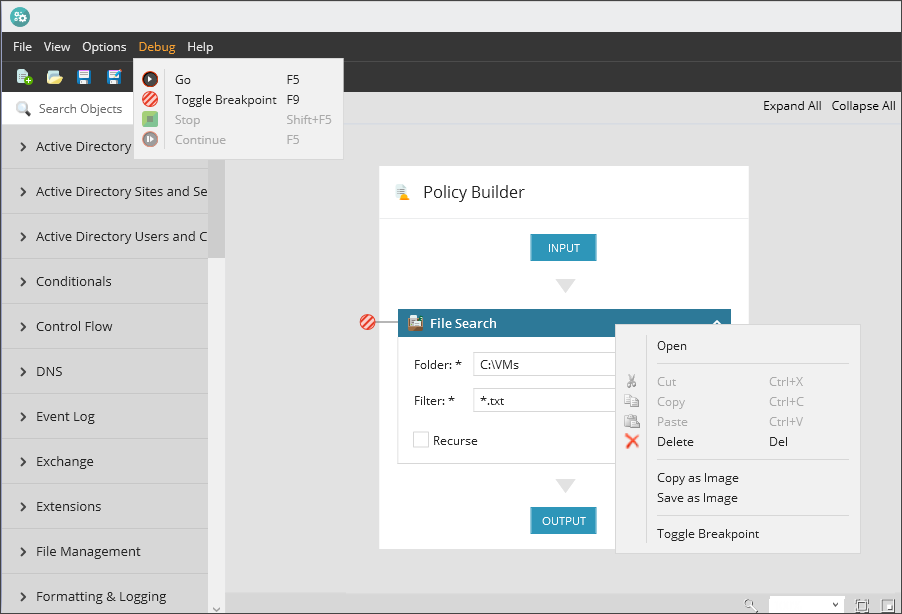
- Go to Debug > Go (or press F5)
- The Debug results appear in the Automation Manager's Output South-pane for review
Stop debugging at any time:
- Go to Debug > Stop, or
- Click the stop icon in the toolbar, or
- Press Shift+F5
To resume debugging:
- Go to Debug > Continue, or
- Press F5
Breakpoints
Breakpoints pause the policy at specific points. This allows you to review the policy's current output before proceeding.
To set an object as a breakpoint...
- Select the object to act as a breakpoint
- Highlight the object and press F9, or
- Right-click on the object and Toggle Breakpoint, or
- Select the object, go Debug and Toggle Breakpoint
- Breakpoint objects are indicated with the breakpoint icon

- Repeat for each breakpoint object
Breakpoints require confirmation before debugging can continue.
What do you want to do?
- View the Automation Manager Overview and learn about policy components (objects, control flow, parameters etc.)
- Learn about using custom PowerShell scripts in the policy
- Discover how to edit a policy (.amp script)