
Filter and sort workspace data
Filter an Ecoverse workspace to show only the data you need. You can filter by chart element, column value, date, or a combination of filters. You can also sort columns in ascending or descending order. For example, you can filter Active Issues to show failed antivirus update checks for a specific date and then sort the results by client name.
For filters with multiple conditions, see Build a custom filter.
Before you begin
- Open an Ecoverse workspace.
- To filter by chart, display the charts. See Customize a workspace layout.
Filter by chart element
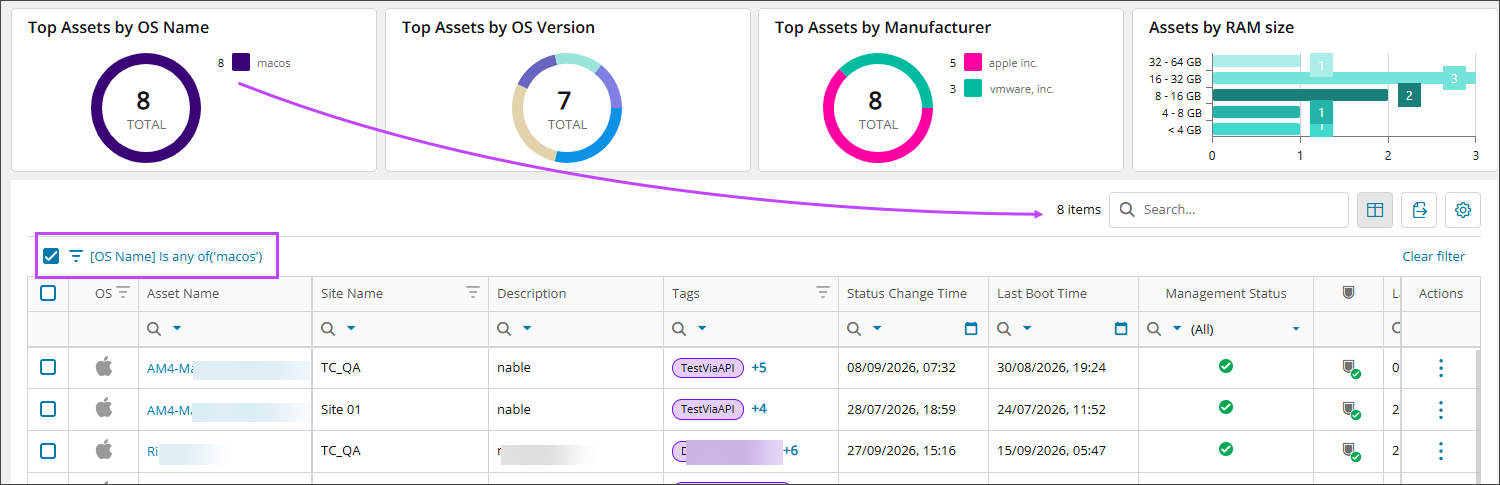
- In a chart, select an element. For example, select macOS.
- (Optional) Select more chart elements to narrow the results further. For example, select vmware.
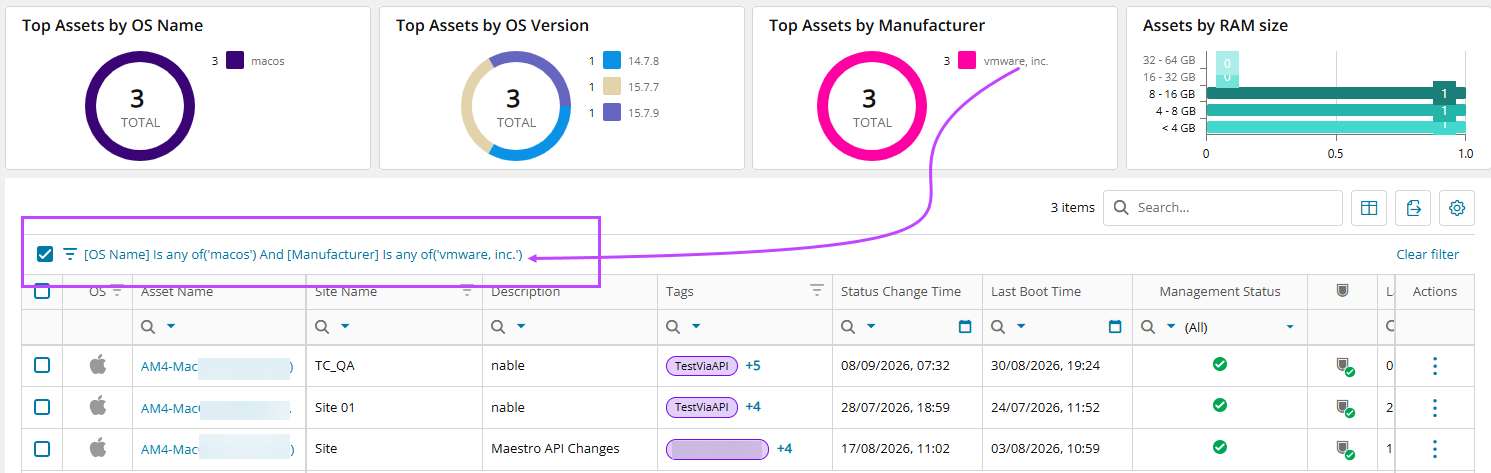
The charts and the table show only data that matches the selected elements.
Filter by a date range
- In a date column header, select the magnifying glass.
- Select Between.

- Select the calendar icon for Start.
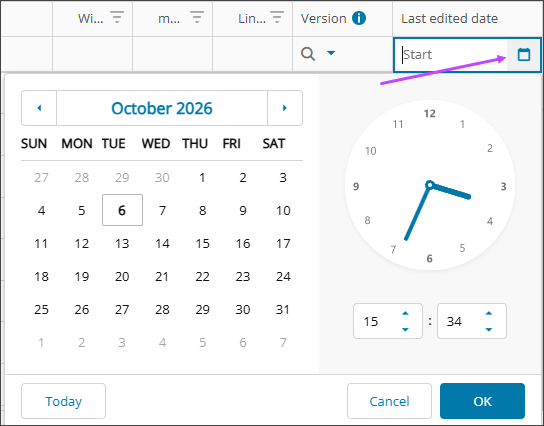
- Select a start date.
- Select OK.
- Select the calendar icon for End.
- Select an end date.
- Select OK.
The table shows only rows within the selected date range.
Filter by one date
- In a date column header, select the calendar icon.

- Select the date.
The table shows only rows for that date.
Sort a column
- In the column header, select the column name.
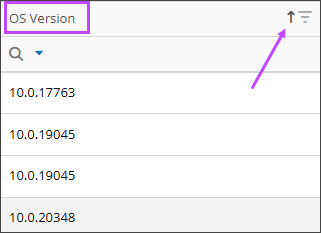
- Select the ascending or descending arrow.
The table updates to show the data in the selected order.
Result
The table shows only the data that matches your filters, in the order you chose. You can save filters in a view. For more information, see Save a workspace view.
Related topics