Build a custom Web Protection Report
Web Protection is now disabled by default for:
- New customer accounts.
- Existing customers who have not previously enabled Web Protection.
See Web Protection for details.
Generate a custom Web Protection report when you need detailed insights. For example, you can list all devices that accessed a specific website or category, or view all the available data for a single device.
To protect data privacy, you can choose not to display visited URLs in the Web tab or in client-facing reports. If you prefer this option, contact your N-sight RMM account manager. In some regions, URL data is disabled by default to comply with local privacy laws.
To build a custom Web Protection report:
- In the All Devices view, go to Reports > Web Protection Reports > Report Builder.
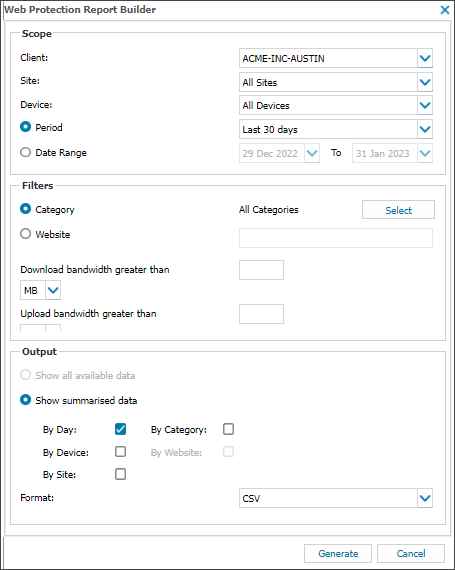
- Select the target Client, Site, and Device.
- Select a Period or Date Range.
- Filter the data:
- Select Category to filter by one or more categories, or all categories.
- Select Website to filter by a specific website. Enter at least three characters.
Search behavior:
- If your search includes a period (for example, www.zy.xyz), the system performs an exact match.
If your search does not include a period (for example, xyz), the system uses a wildcard search (xyz.*).
- (Optional) Set bandwidth thresholds:
- Enter values for Upload bandwidth greater than and Download bandwidth greater than.
- Select the unit of measure.
- Choose what to include in the report:
- Show all available data (available only when you select a single device).
- Show summarized data. Select one or more of the following:
- By Day
- By Device or By Site
- By Category
- By Category is only available when you filter by category.
- By Website is available when you filter by website or view data for a specific device.
- Bandwidth filters apply to summarized totals, not the individual records. Results my vary based on the selected summary options.
- Select the report Format.
- Select Generate to create the report.
The report opens in HTML format or downloads a CSV file.
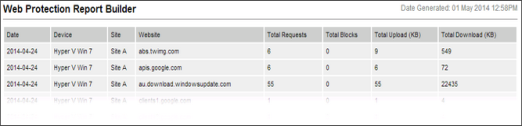
Example report filtered By Day, By Device, and By Website