
Data in the
The overlay shows all available information for the selected asset. It includes at-a-glance data and tabs for details, activities, patches, scripts, and AI services.
At-a-glance data
A quick reference section at the top of the overlay that shows:
- Device status as an icon:
 Online
 Offline
If it does not match the Assets view, refresh the page.
- Operating system and asset type
- Last reboot time
- Customer and site name
- Assigned tags
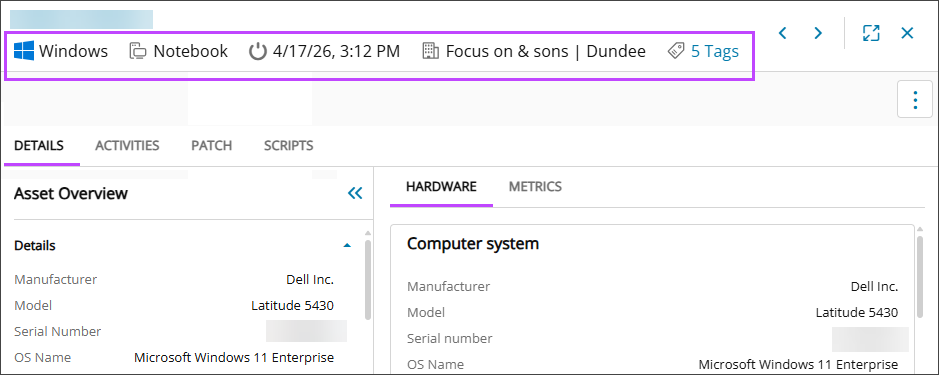
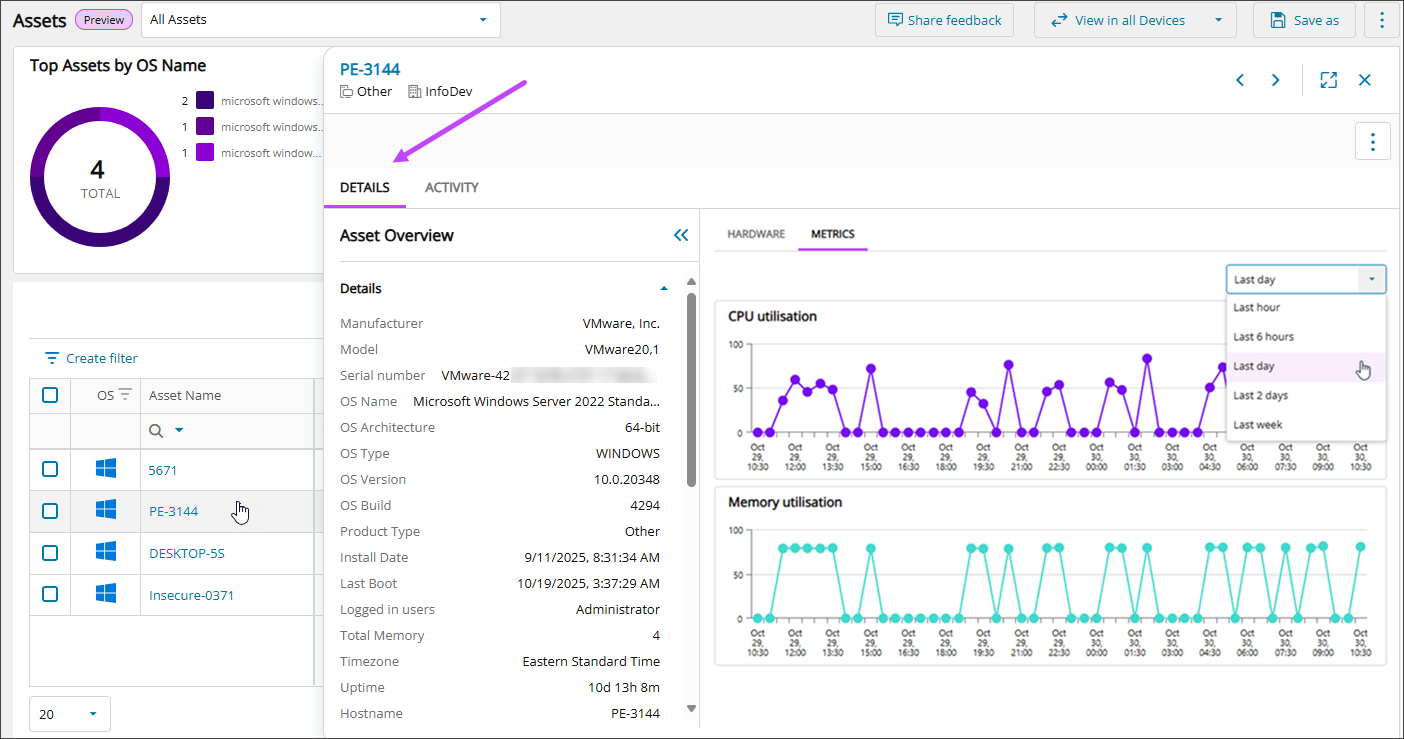
Details tab
The Details tab includes three sections:
- Asset overview
Displays the operating system, model, serial number, TPM information, and network interfaces. Information may vary depending on the asset’s OS.
- Hardware
Includes information about the computer system, processor, motherboard, physical drives, installed memory, and network adapters.
- Metrics
Shows graphs for CPU and memory utilization over a selected time.
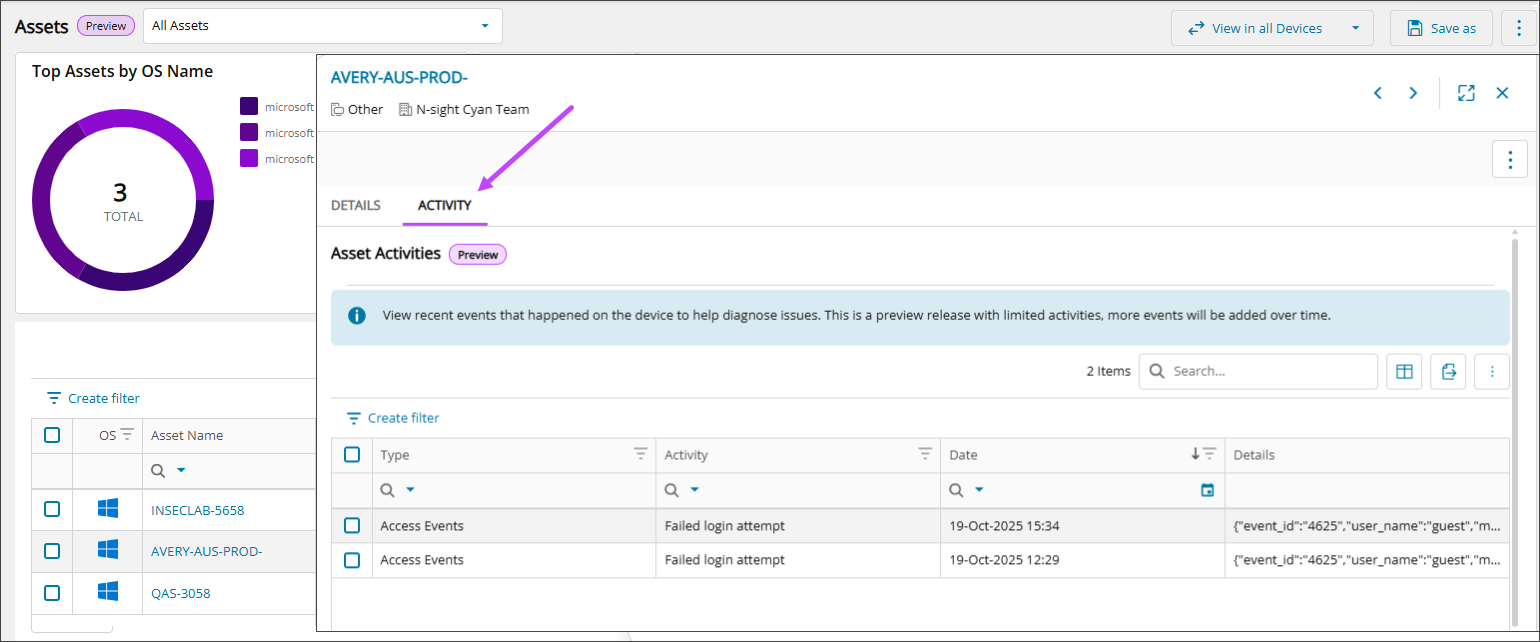
Activities tab (Windows assets only)
The Activities tab shows recent events related to the asset, including access activity, system shutdowns, and system crashes. For system shutdown and reboot events, you can select the event to review the full event context.
For the supported Event IDs, see Supported asset activity events .
The events data updates every 30 minutes, at 15 and 45 minutes past the hour. On average, the data is about 15-minutes behind real-time activity.
Activities might not appear for an asset for these reasons:
- The feature currently supports only Windows assets that have the Modern agent installed.
- If the Event Log is larger than 20 MB, activities are not captured. Most assets have logs of this size or smaller, but some servers may have larger files.
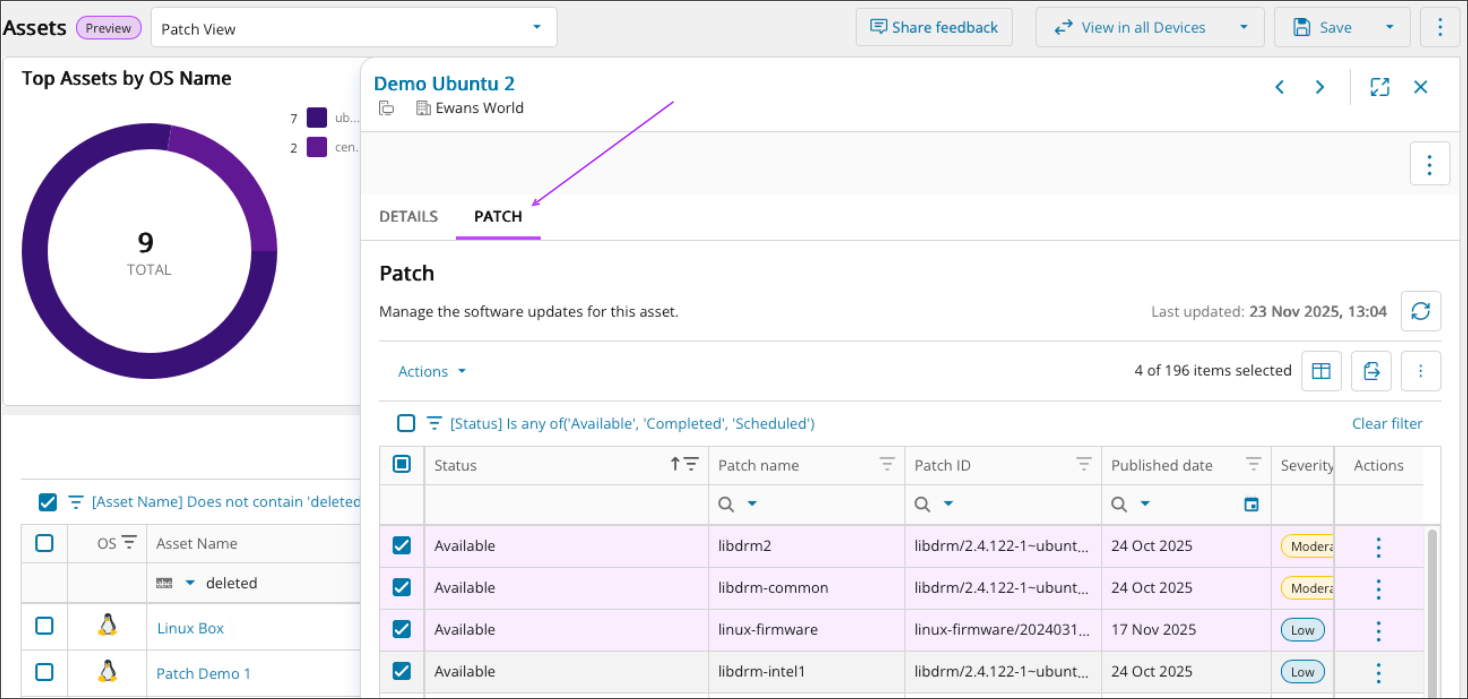
Patch tab (Linux assets only)
Use the Patch tab to track and start patching for the Linux asset. You can view patch installation status, schedule patches, control reboots, and access historical patch data.
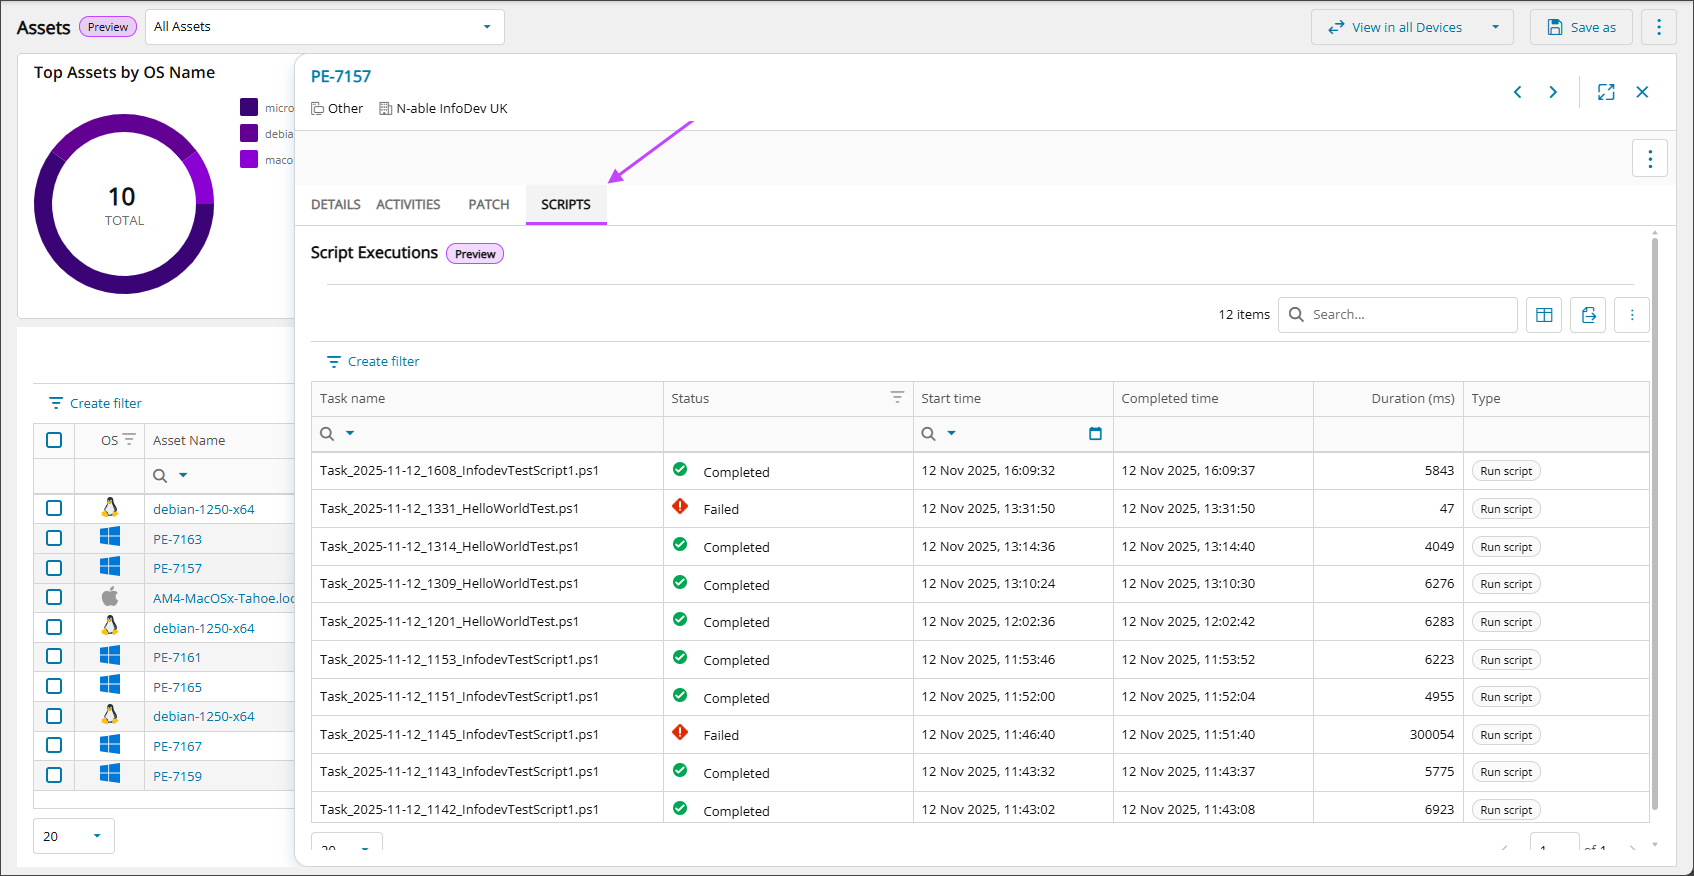
Scripts tab
The Scripts tab shows recent scripting events related to the asset, including Status, Start time, Completed time, Duration (ms), and Type.
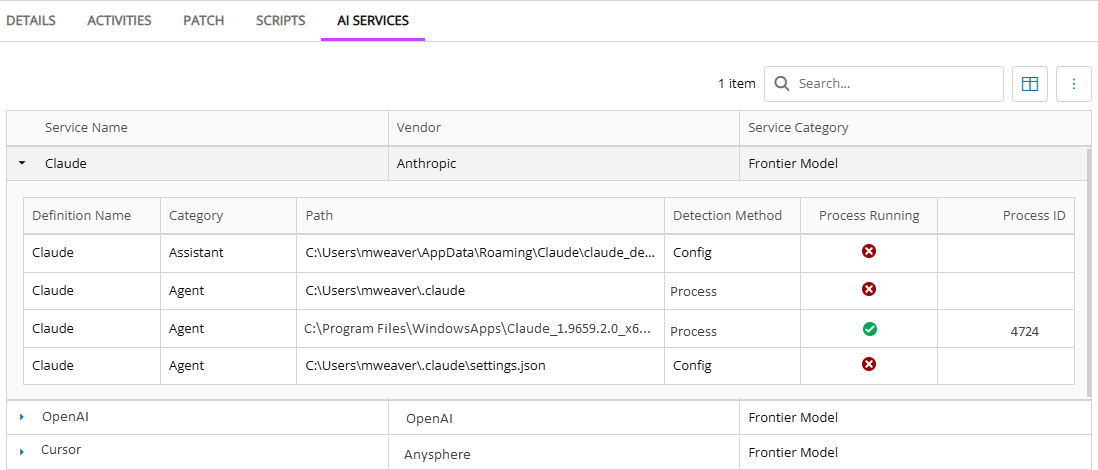
AI Services tab
Employees often install AI tools such as Claude Desktop, Cursor, ChatGPT, or local large language models (LLMs) on managed assets without IT visibility. You need to understand what is installed, where it is installed, and who is using it.
Use the AI Services tab to view AI usage on an asset. N-sight combines the following four detection methods, each contributing specific signals that together create a complete view.
Install path detection method
Determines whether an application is installed.
- Checks known installation directories.
- Detects applications even when they are not running.
- Example paths include:
C:\Users\John\AppData\Local\Programs\cursor/Applications/Claude.app
Configuration file detection method
Determines whether a user has configured the tool.
- Searches for tool-specific configuration files.
- Confirms the tool has been set up and used.
- Example files include:
~/.cursor/mcp.json~/.claude.json
Running process detection method
Determines whether the tool is in use.
- Scans active processes on the asset.
- Identifies real-time usage.
- Example:
- Detects
Claude.exerunning with a process ID (PID).
- Detects
Browser activity (DNS) detection method
Determines whether a user visited an AI platform through a web browser.
- Reads browser history on the asset from the following supported browsers:
- Chrome
- Edge
- Firefox
- Brave
- Opera
- Classifies visited URLs against a static allowlist of AI platform domains.
- Identifies the platform visited, not the specific tool used.
For the list of supported services, see AI services supported for detection.
Related articles