
With the Mail Assure Splunk integration, message audit data can be sent to Splunk in real-time, allowing the integration of the insights from this data into your wider SIEM (Security Information and Event Management) processes.
As with the Custom logging (remote syslog) functionality, data about each message is sent as it arrives, updates with each delivery attempt and further updates for any training users do for misclassified messages. Unlike the remote syslog feed, configuration of new templates are not required for the data as it is sent in a structured format to Splunk, that will handle the data indexing.
After activating the integration, message audit logs will flow into Splunk, where insights can be built into the mail and mail-borne threats your customers are receiving and sending.
Each user (at domain or admin level) may configure a Splunk feed, which will be appropriately restricted to events for that user.
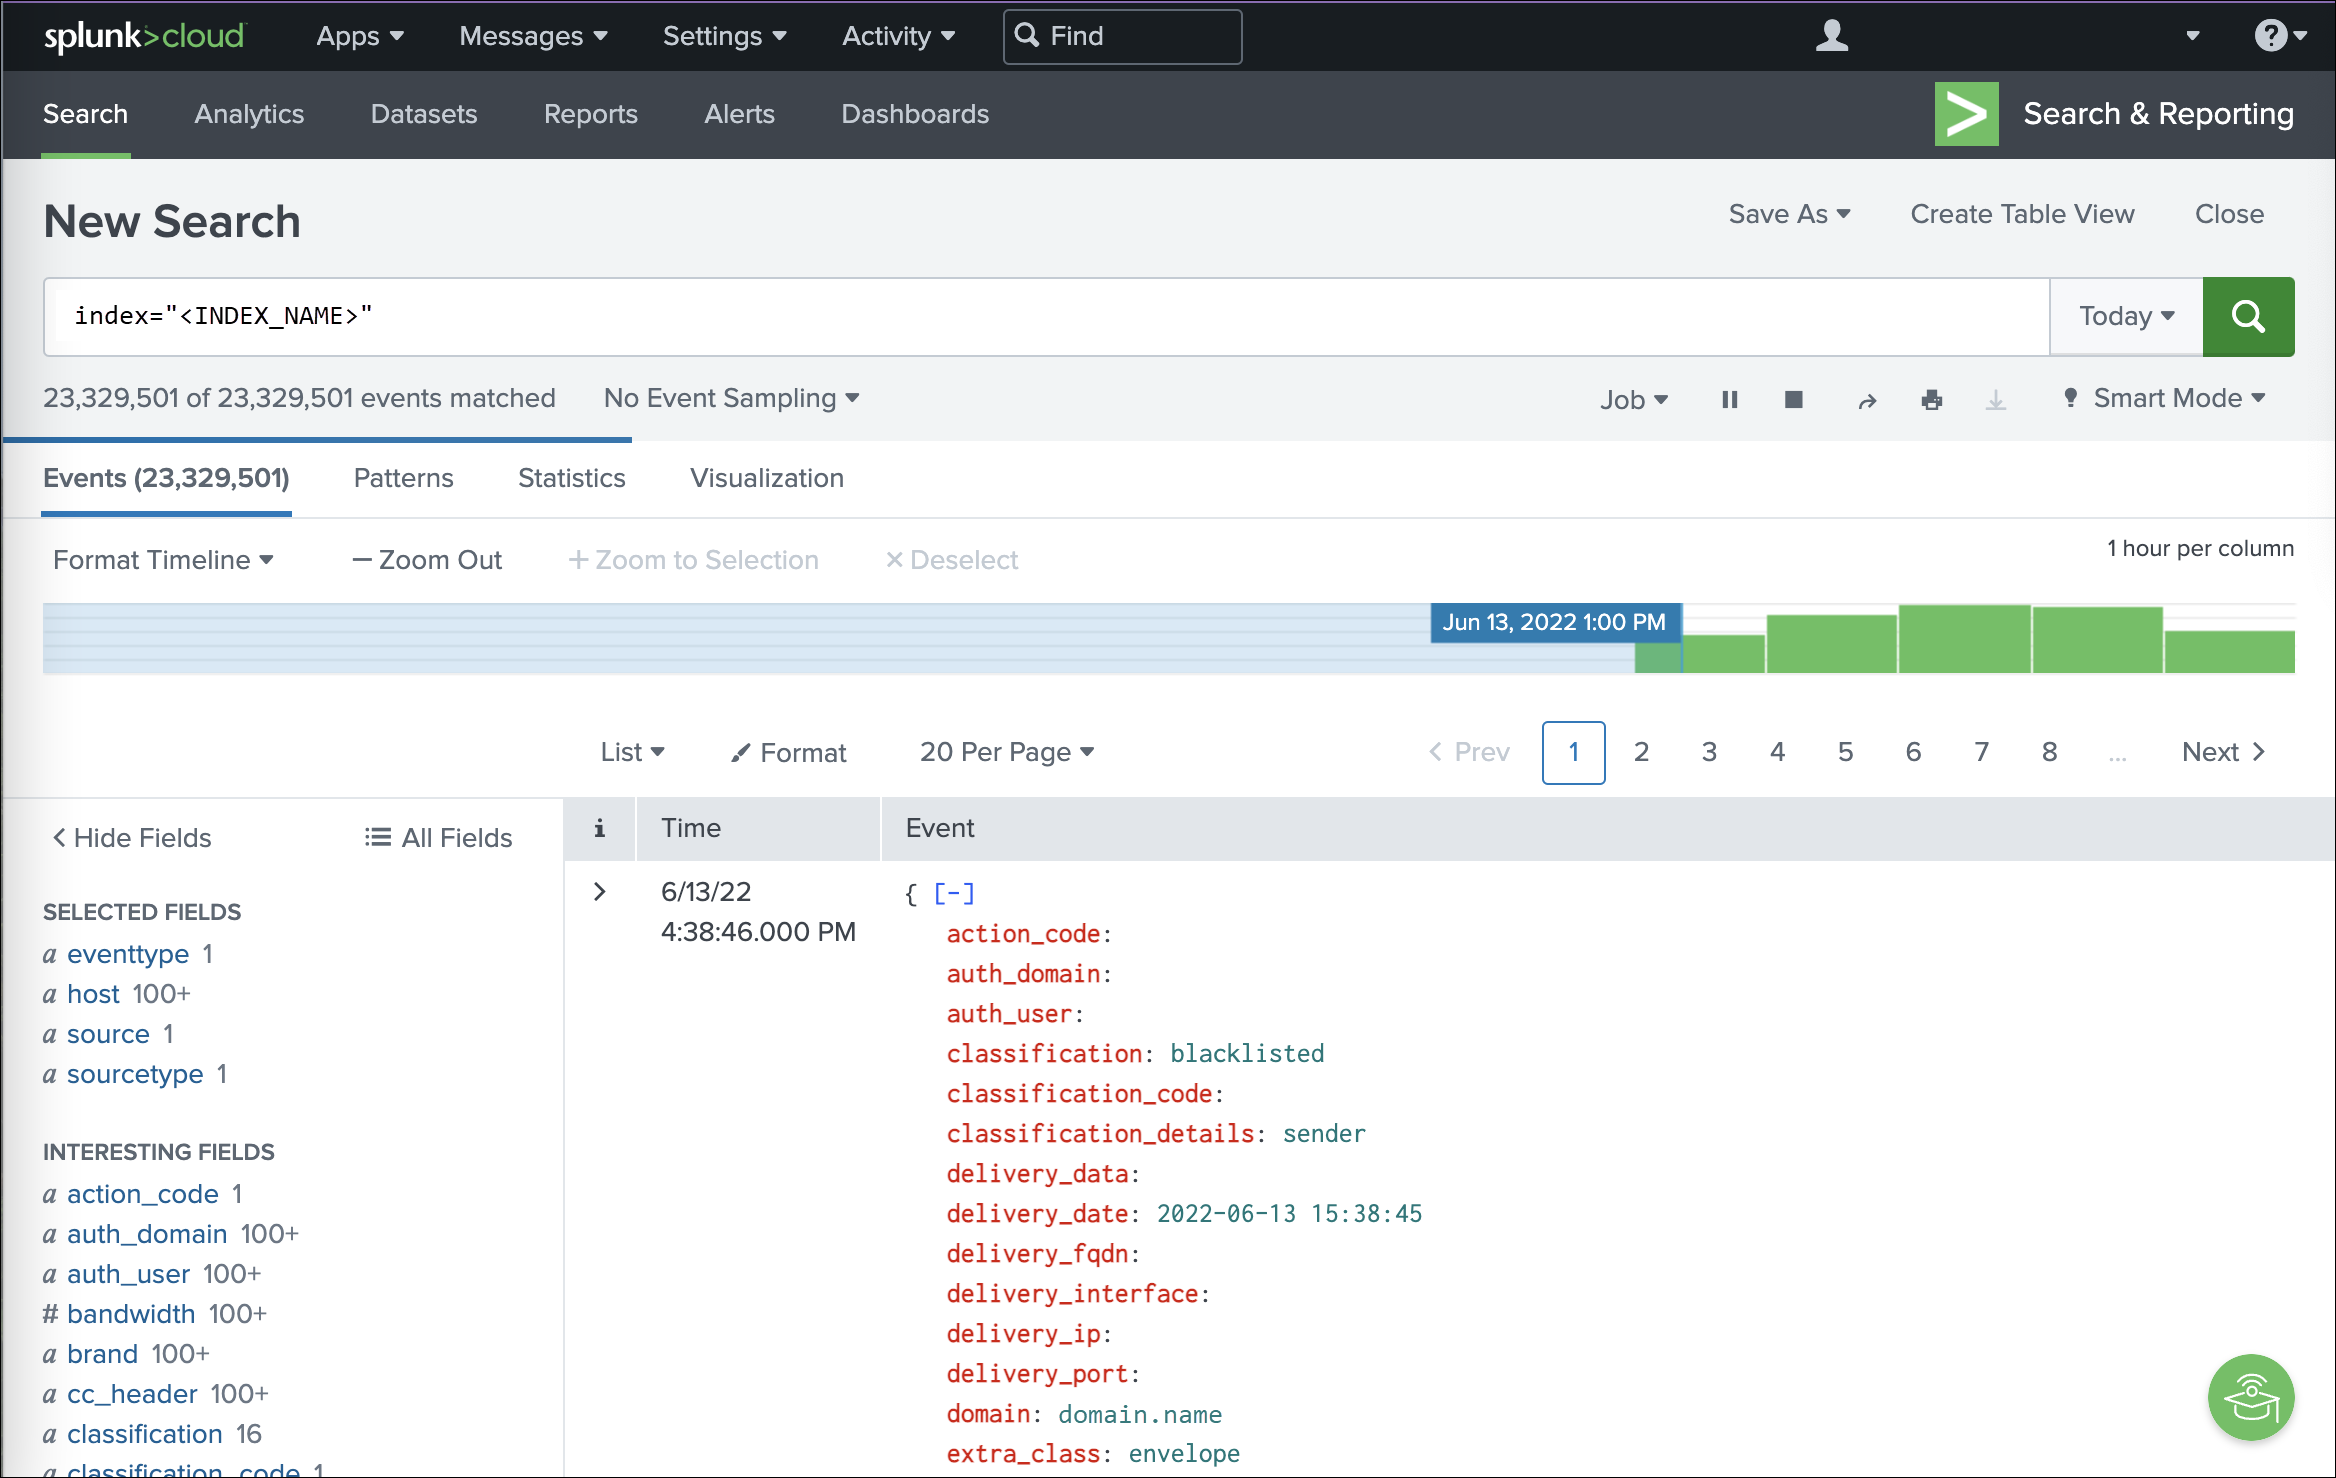
Splunk automatically surfaces interesting fields, displaying event volume and patterns, even when just querying the index:
Through Splunk's Data Visualizations you can generate graphs and dashboards from the imported data.
How to setup Splunk logging
- Login to Mail Assure as an Admin Level user or as a Domain Level user
- Go to Reporting > SIEM logging integrations in the left menu pane
- Select the Splunk logging tab
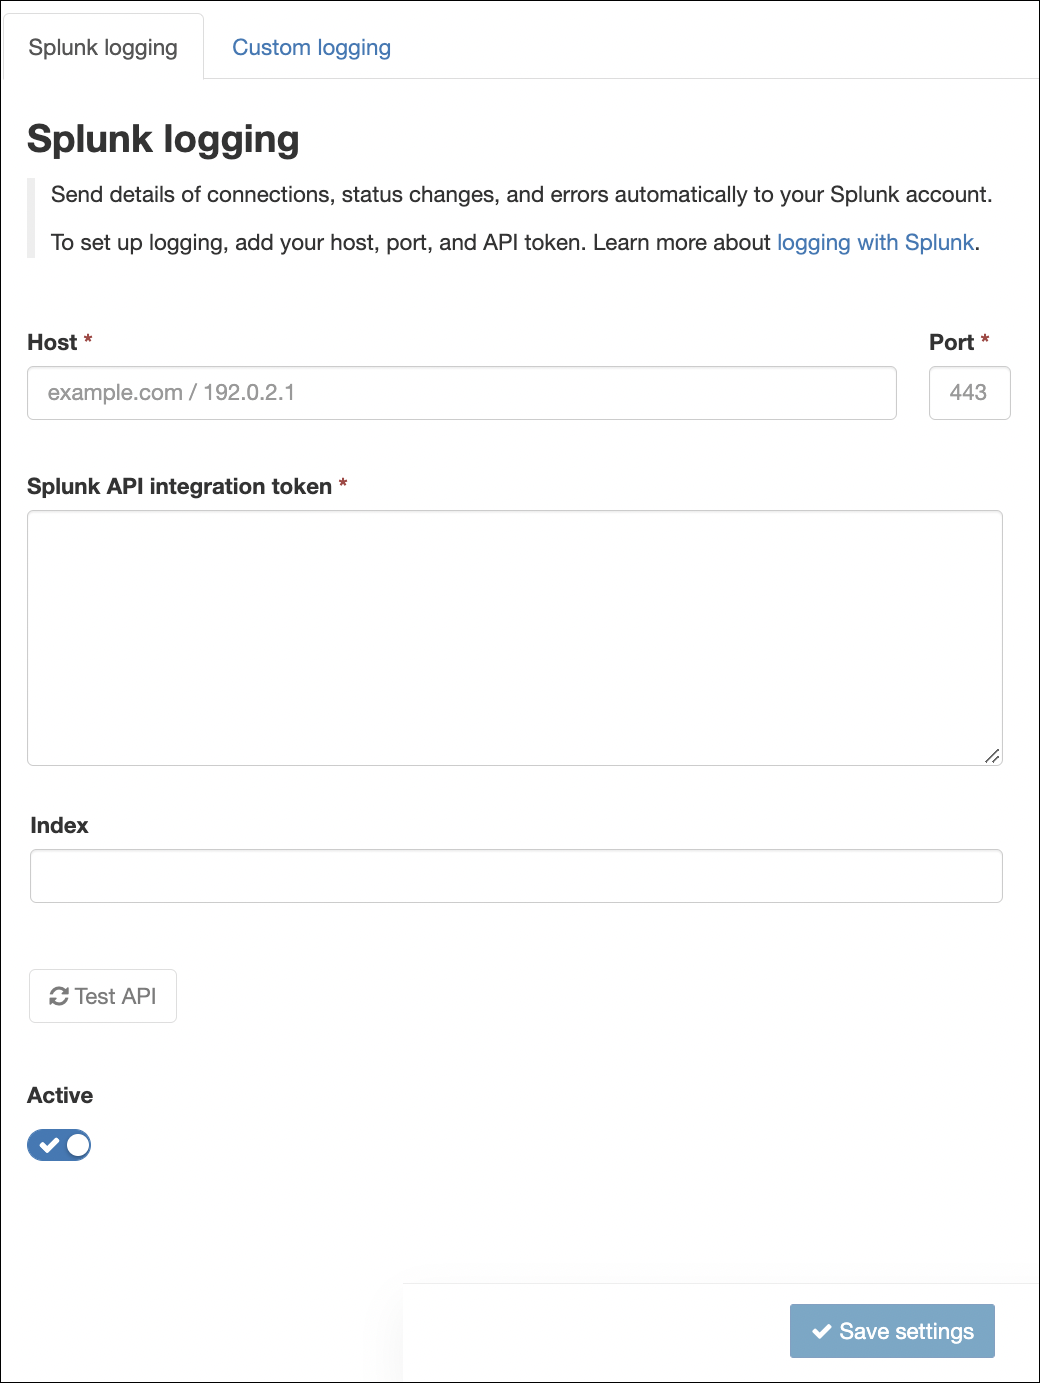
- Enter the information for your Splunk instance:
- Host: the Splunk server to receive notifications (Required)
- Port: the port to connect to your Splunk server over (Required)
- Splunk API Integration token: the Splunk HTTP Event Collector API token used to authenticate requests when sending log events to Splunk
- Index: the repository for the imported notification data in Splunk. The default index for the token (as configured in Splunk) is used if this is left blank (Optional)
- Once configured click Test API. This action sends a test log event to verify the API token and ensure the Splunk service is reachable (Recommended)
- Click the Active toggle to enable Splunk logging (Optional)
- Click Save settings to apply
If logging was activated, an API call to the Splunk instance using the provided details is automatically performed to validate the entered information. When the test fails, an error message is returned with information on the failure.
If logging is inactive, the settings are saved, and you can return to the dialog later to activate.
In order to use Custom Logging with Splunk, your server requires a valid, non-self-signed certificate for encrypted connections. Self-signed certificates, which are used by default in Splunk trial accounts are not supported.
Disclaimer: This documentation may contain references to third party software or websites. N-able has no control over third party software or content and is not responsible for the availability, security, or operation, of any third-party software. If you decide to utilize a release involving third-party software, you do so entirely at your own risk and subject to the applicable third party’s terms and conditions of the use of such software. No information obtained by you from N-able or this documentation shall create any warranty for such software.