User interface of Management Console
You can see a full, detailed breakdown of every aspect of the user interface in the full backup documentation interface page here.
The interface of the Console is based on several primary elements:
Widgets
Most of the data in the Console is presented on widgets. All the widgets are customizable.
Graphic widgets
In the Console, you will see 3 graphic widgets on the home screen.
- The Active Servers & Workstations & Microsoft 365 widget illustrates the distribution of devices by the type of the operating system they are installed on
- The Backup Statuses widget offers a pie chart with the statuses of the latest backup sessions
- The Last Backup widget shows a pie chart with the timing of the latest backup sessions
What you can do with the graphic widgets:
- Expand/minimize a widget using the arrow icon in its right side
- Select data on a widget and reset the selection. By default, the widgets summarize statistics for the devices listed below (see the Devices widget). If you click on a value, the list of devices gets immediately updated to match the selection. It works the other way round too. So if you edit the Devices widget (for example, by choosing another customer), data in the graphic widgets changes accordingly
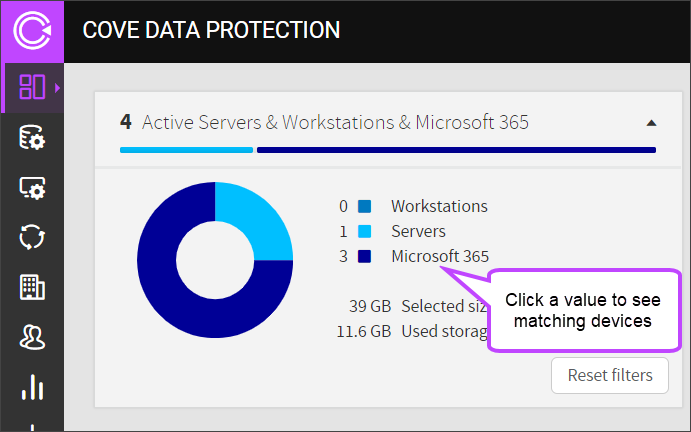
Table-based widgets
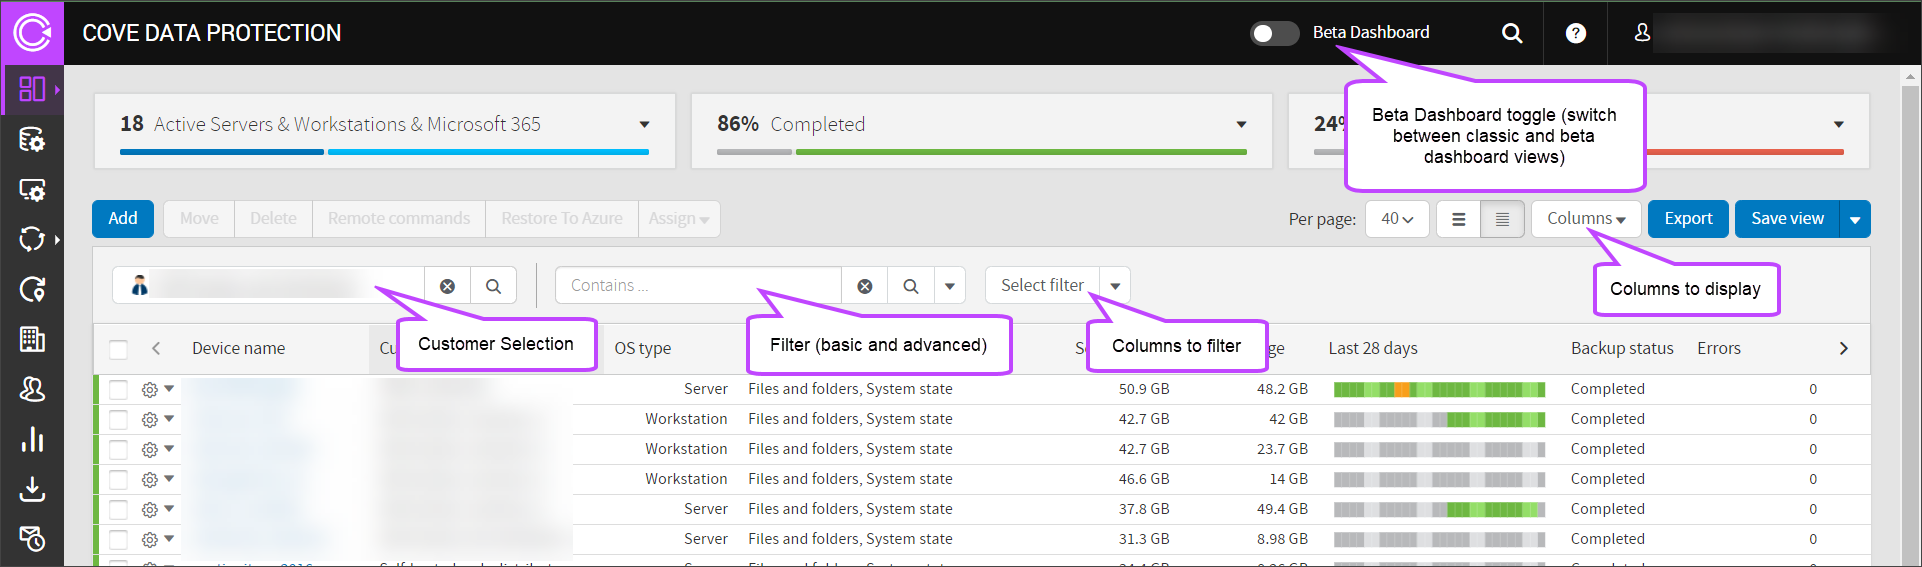
Each module has a table-based widget. For example, the home screen contains the Devices widget. It is based on a table listing devices you have access to. These are devices belonging to your company and your customers.
You can customize the Devices widget in the following ways:
- Choose the columns to display (the Columns list)
- Choose the number of devices to display on a page (the Per page list)
- Filter the devices displayed. Use the default Customer filter or create your own filter.
- Enable sorting by clicking on the header of a column
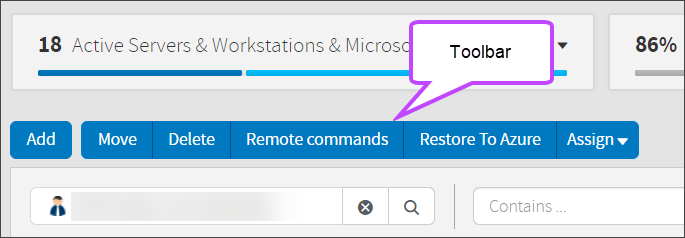
Toolbar
Each software module has a toolbar. The toolbar gives access to the most important functions in the current module. For example, the toolbar in the Home module (aka the Backup Dashboard module) lets you manage selected devices and add new ones.
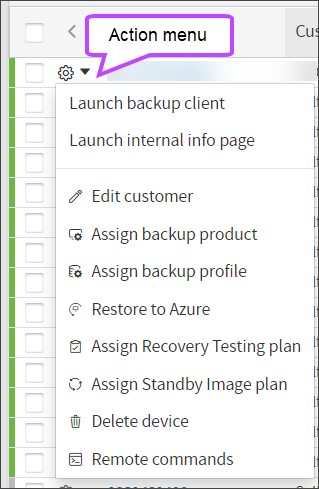
Action menu
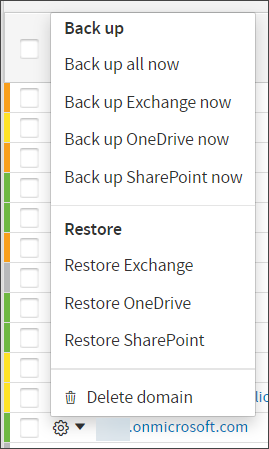
The full selection of device management options is available through an action menu. It opens when you click the gear icon next to the name of a device or right click the device. The view of the Action Menu changes depending on whether you are looking at a Regular device or an Microsoft 365 device.
Regular backup device:
Microsoft 365 domain:
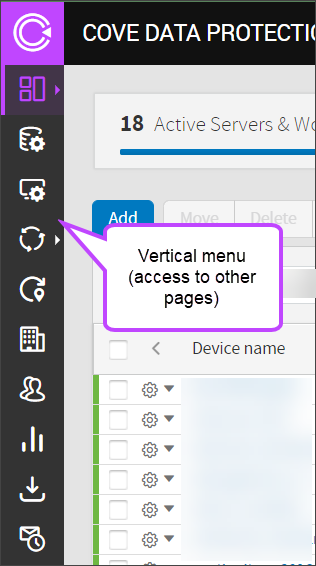
Vertical menu
A vertical menu on the left side of the screen lets you navigate from the home module (Backup Dashboard) to other software modules and back.
Information panel
The information panel is broken into three distinct areas:
- Information box
- Help Resources
- Search
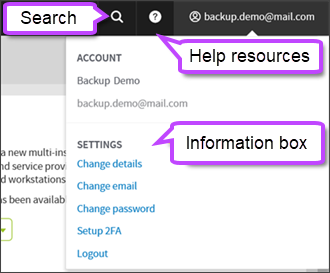
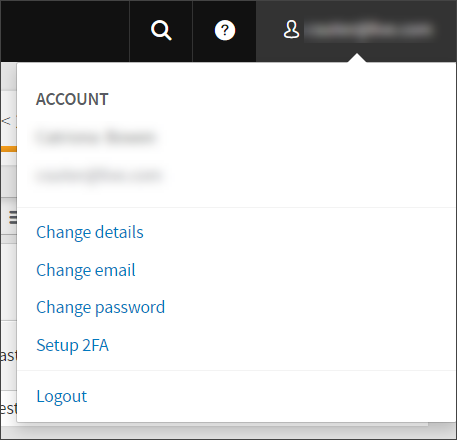
Information Box
The email address used for login to the Management Console can be found in the upper-right corner of the screen. Clicking on this opens an additional menu – the information box – that gives access to some more options:
- The account details of the user logged in
- Change details
- Change email
- Change password
- Setup 2FA
- Logout
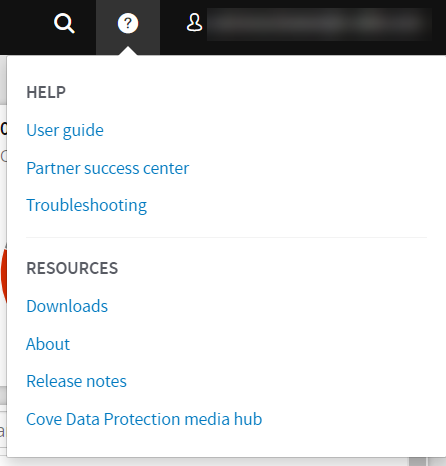
Help Resources
The help resources box provides several links to resources we hope you will find useful, including to:
- Help:
- User Guide
- Partner Success Center
- Troubleshooting
- Resources
- Downloads
- About
- Release Notes
- Cove Data Protection Media Hub
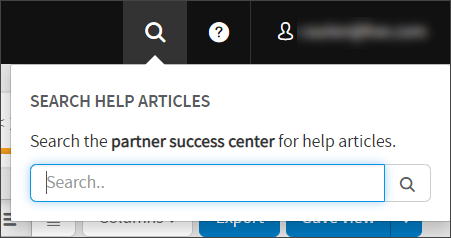
Search
This search function allows you to search in the Partner Success Center for Knowledge Base/Troubleshooting articles to help resolve issues.