
Create WMI-based Custom Monitoring Services
WMI (Windows Management Instrumentation) is an implementation of the Web-Based Enterprise Management (WBEM) standard. It provides an access mechanism to a vast collection of Windows management data and methods on Windows Servers and Windows Workstations.
Many of the services N-able N-central is set up to monitor use WMI queries to collect performance information or asset information from Windows devices. If there is something you want to monitor that is not included in a built-in service, and it is stored in WMI, you can create your own WMI-based service.
Creating WMI-based services requires knowledge of how the WMI protocol works. For information about WMI, see the Microsoft Developers' Network online library documentation.
The steps below provides a very simple example which checks that the browser service has started and retrieves information about it.
- Click Administration > Service Management > Custom Services.
- Click Add > Service > WMI (Window Workstations and Windows Servers).
- Enter a Name and Description for this service.
- On the Queries tab, click Add .
- Enter Win32_Service in the WMI Class field.
- You now need to add the Win32_Service properties that you want to access:
- Double-click LoadPercentage1 and change to the first property that you want to monitor. Enter Started.
- To add another property, click the blue plus (+) button after Select. Change this to Status.
- In the same way, add Description.
- Set the constraint, so that this information is only retrieved where the service name is "Browser":
- Click the blue plus (+) button after Where.
- Double-click Deviceid1 and enter Name.
- Double-click CPU1 and change it to Browser.
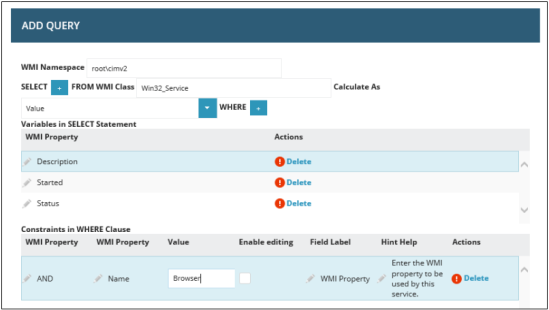
- Click Save.
You have created a SELECT statement to retrieve the Started, Status, and Description values WHERE the service Name is Browser.
- On the Data and Thresholds tab, click Add Metric. We now need to say how we want to handle this information.
- Enter the name you want to give the first metric. Enter Browser Started.
- For Variable to Use, select $Started.Win32_Service.root\cimv2.
- For Data Type, select Boolean.
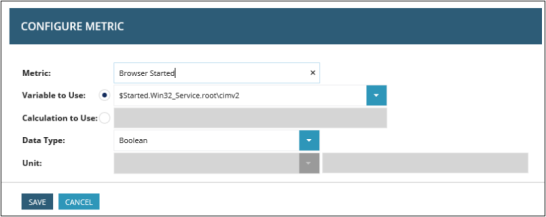
- Click Save.
- Repeat for Status and Description, using String as the Data Type.
- Click Configure Thresholds for the Browser Started metric in the Action column.
- Select Failed in the If Test returns False, Display State As drop-down list box.
- Select Normal in the If Test returns True, Display State As drop-down list box.
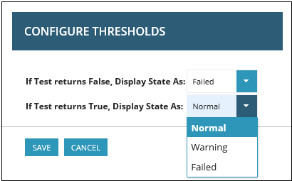
- Click Save.
- If you want to set the scanned frequency for this service, you can set it on the Schedule tab.
- Click Save.
You can add this service to a template or to any Windows server or workstation as described in Apply Custom Monitoring Services.