
Connect to Microsoft SQL Server using BrightGauge
Connecting Microsoft SQL Server to BrightGauge can transform how you visualize and interact with your data. This integration allows you to pull real-time data directly into BrightGauge’s customizable dashboards and reports, providing a comprehensive view of your metrics and KPIs. With this setup, you can streamline data analysis, enhance decision-making processes, and monitor your business performance more effectively, all in one user-friendly platform.
In this page:
Prerequisites
-
Setup the Microsoft SQL Server to Snowflake connection.
Permissions
-
Administrator access in BrightGauge to add new datasources, create datasets, and configure gauges.
-
Permissions to access and manipulate the data within BrightGauge.
Add a new Datasource in BrightGauge
-
Log into BrightGauge: Ensure you have the necessary permissions to manage datasources and create gauges.
-
Add a New Datasource:
-
Once logged in, locate the Data dropdown menu in the upper right-hand corner of the dashboard.
-
Choose Datasources and select the option to add a new datasource.
-
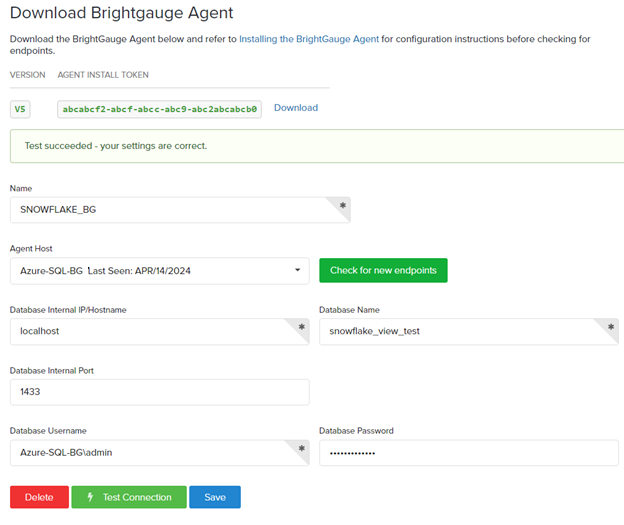
Click on Database then select Microsoft SQL from the list. This action will guide you through setting up your BrightGauge agent for MS SQL.
-
-
Install and Test the Connection: After saving the configuration, use the Test connection feature to confirm there is a functional database connection from your Microsoft SQL instance to BrightGauge.
Creating a Dataset and configuring a Test Gauge
In BrightGauge, a dataset represents a specific set of query able data. The datasets can then be used to construct gauges, the Key Performance Indicators (KPI) used in Dashboards and Reports.
Create a Dataset
-
Navigate to DATA > Datasets.
-
Click Create Dataset.
-
Select the Datasource.
-
Enter a descriptive Name for the dataset, and Description (optional).
-
Select the Dashboard Sync Frequency.
-
Enter your SQL query. As an example, we will create a dataset using the DIM_Customer_1 table, which contains customer information from your N-central analytics data.
-
Test your query and resolve any errors.
-
Click Save (only available after clearing all).
SELECT customer_id as ‘id’, parent_id, name, created
FROM SNOWFLAKE.SHARED_ANALYTICS_DATA.SHARED_DATA.DIM_CUSTOMER_LATEST AS DIM_CUSTOMER_LATEST_1

Configure a Test Gauge
-
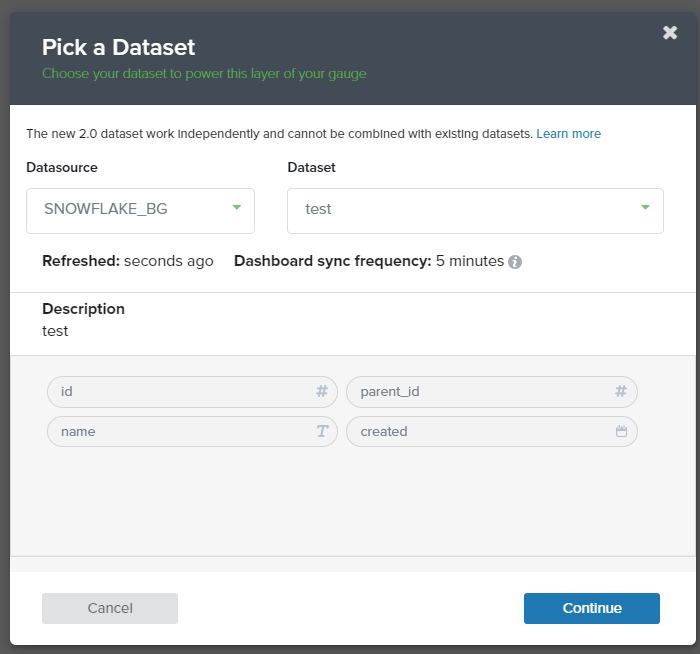
With your dataset ready, proceed to set up a test gauge by clicking on the green + sign and selecting Gauge.
-
You will be prompted to choose your datasource and dataset, with information on the dataset displayed.
-
Click Continue to open the gauge builder.
-
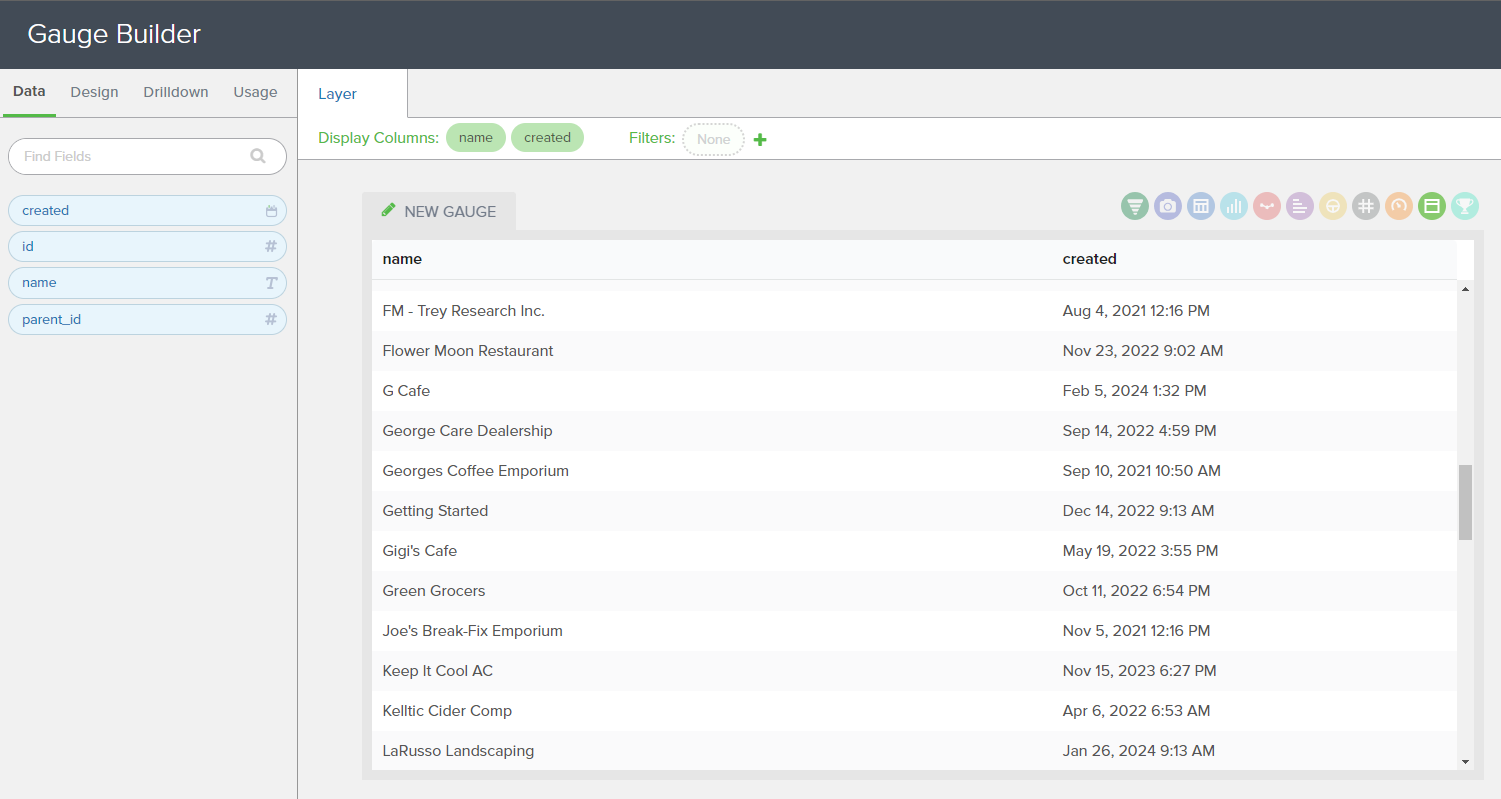
For this demonstration, we will add two columns of data to represent customer onboarding dates, which indicate when customers were first created in N-central.
-
Select the green list gauge type.
-
Under Columns, drag and drop the Name and Created fields into your gauge layout.
-
Click the Design tab to format the data fields.
-
Once you have configured the columns, give your gauge a meaningful name, such as “Customer Onboarding Dates”.
-
Congratulations! You have now created your first gauge using data from the DIM_Customer_1 table in N-central, utilizing Direct Data Access in Snowflake.