
Monthly Report Information
The Monthly Report graphically displays the check information recorded for the 24x7 and Daily Safety Check over the month. The information covers all of the servers or sites registered to the Client and their check performance.
The Client Monthly Report footer from page 2 onwards has a limit of 40 characters. If your N-sight RMM user interface name exceeds this threshold, we display the first 39 characters and include an ellipsis (...) to indicate that it contains additional characters.
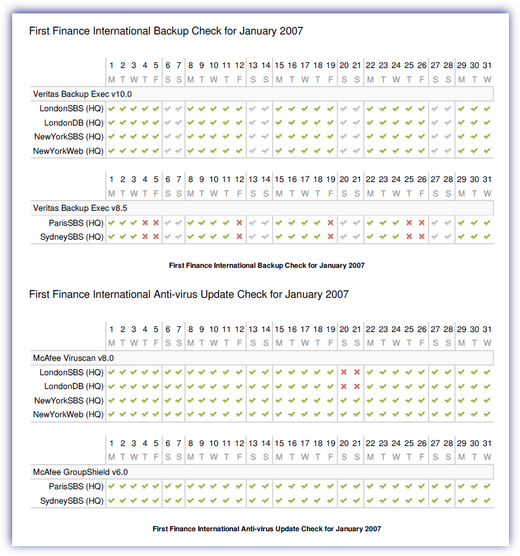
All Sites
This charts the success or otherwise of the Backup and Anti-virus Checks for the month on all the Client servers for which Server Monitoring Reports have been configured.
- Green tick indicates a pass
- Red cross indicates a failure
- Transparent tick indicates that the Check is not configured to run on that day
Percentage Good Analysis
The graphs show the percentage of time that the 24x7 Checks or Daily Safety Checks were good (if the check passed or the server was placed offline) for a given server.
- Green indicates that the check was 100% good
- Yellow indicates that the check was more than 75% good
- Red indicates that the check was less than 75% good
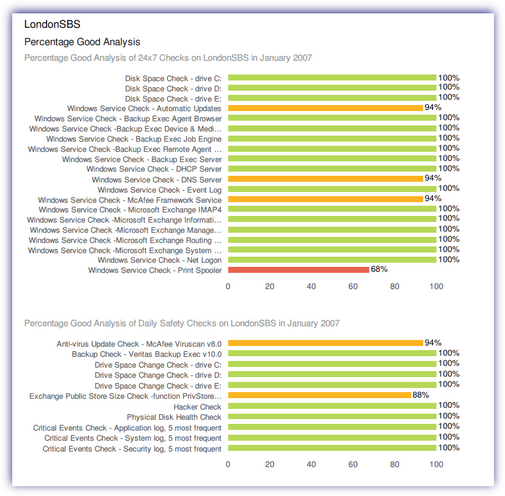
Please note: charts cannot span pages so the maximum number of checks we can have in a chart is 35. If the server has more than 35 checks, then we group them by check type (e.g. Windows Service, Disk Space, Performance Counter etc) so that we can still draw the chart in the report.
Outage Analysis
The graphs display a breakdown of the 24x7 Check or Daily Safety Check Outages on the given server during the month and how this compares to the trend for the preceding 12 months. Please note that consecutive check failures are treated as a single outage.
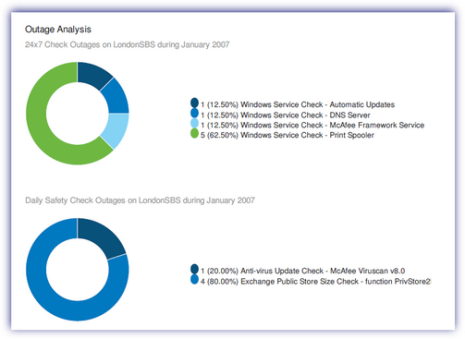
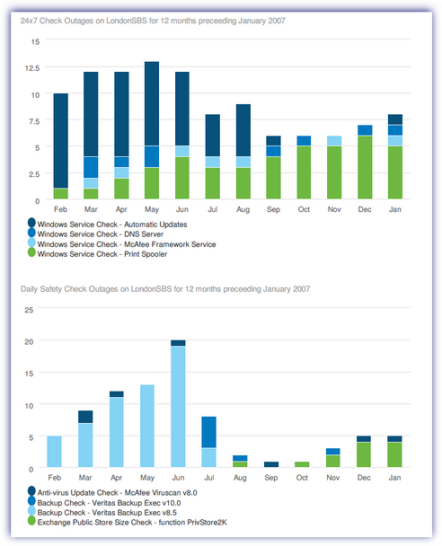
Please Note as it is not possible for charts to span two pages the number of data points in the legend is limited to 15. If there are more than 15 individual checks that have failed over the previous year then in order to still draw the chart we group the checks by type, for example AV checks, Backup checks, Ping checks etc.
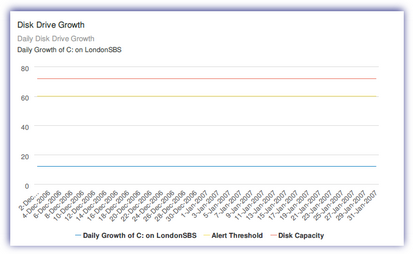
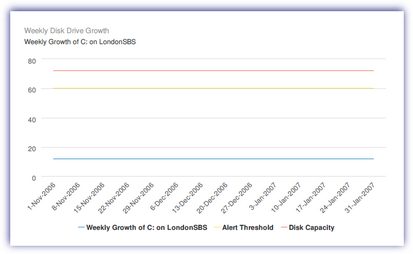
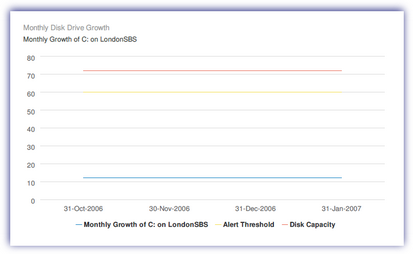
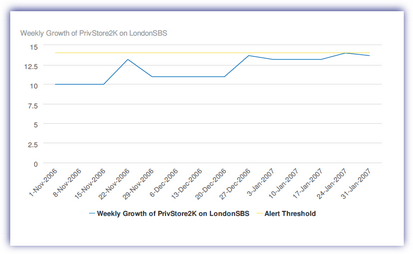
Disk Drive Growth
The graphs show the disk usage growth on the monitored disk drives in the given server for:
- Two months preceding the report month at daily frequency
- Year preceding the report month at weekly frequency
- Five years preceding the report month at monthly frequency (assuming sufficient data exists)
The Alert Threshold line indicates the size that has been configured to generate an alert should usage on the monitored disk exceed this.
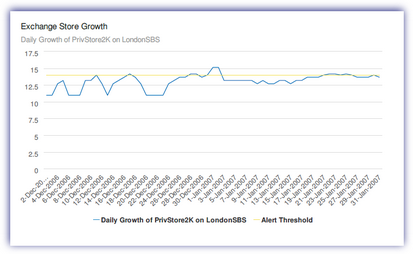
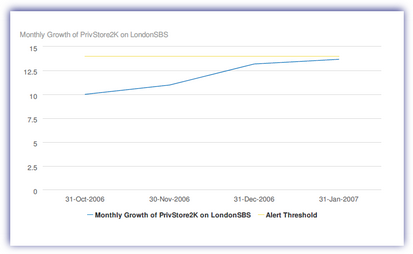
Exchange Store Growth
The graphs display the growth of the Microsoft Exchange Public Store on the given server for:
- Two months preceding the report month at daily frequency
- Year preceding the report month at weekly frequency
- Five years preceding the report month at monthly frequency (assuming sufficient data exists)
- The Alert Threshold line indicates the size that has been configured to generate an alert should the Exchange Public Store exceed this.
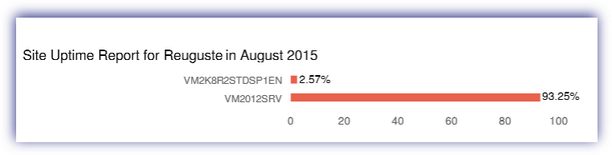
Site Uptime
The Site Uptime graphs show the percentage of time that each server was online (and not offline, overdue or unreachable) at a given site.
- Green indicates that the server was more than 99% online during the month (or from the date the Agent was installed on that server)
- Yellow indicates the server was more than 95% online
- Red indicates the server was less than 95% online
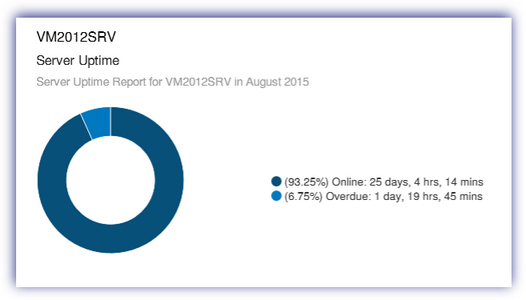
Server Uptime
The Server Uptime graphs show the breakdown of the time, both absolute and percentage, that the given server was online; offline (either when the server has been shutdown or the Agent is in offline); overdue or when the site is unreachable (if the data overdue crosscheck has been configured for the site) during the month (or from the date the Agent was installed on that server).
Patch Management
The Installed Patches table shows a list of patches installed during the selected month ordered by severity.
The Missing Patches table shows a list of patches that are missing ordered by severity.