
Apply a custom filter on the All Devices view
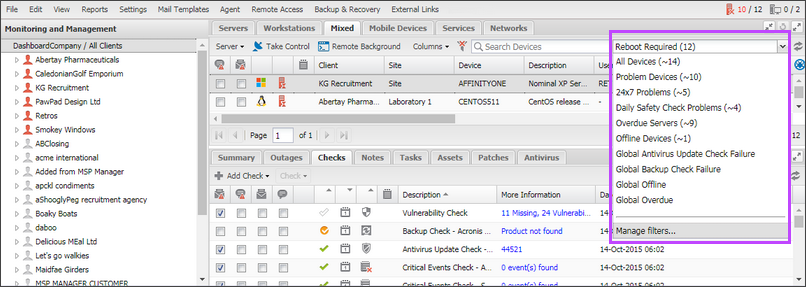
If you label a custom filter as a favorite or Run in Dashboard, it is accessible from the Device filter drop-down in the All Devices view North-pane.
After you select a filter, it is applied regardless of the North-pane tabs you navigate through: Servers, Workstations or Mixed.
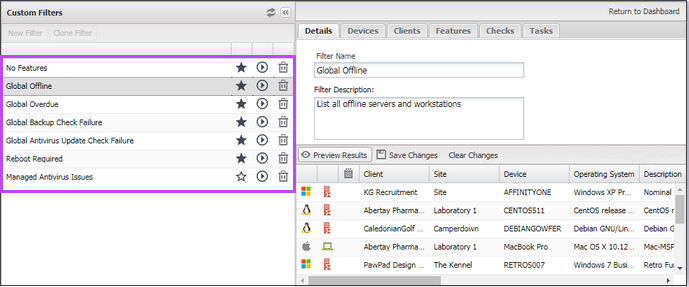
The following images show the custom filters in the Filter Manager, and then the favorite filters displayed in the Device drop-down menu in the All Devices view.
Download a CSV of the custom filtered North-pane
You can export the North-pane device details to CSV when viewing a custom or "Last Response Over 30 Days" filter. The download option is grayed out for all other default system device views.
- Select the custom view from the Device filter drop-down above the North-pane in the All Devices view.
- After the filtered view displays, click the download button to the right of the Device filter drop-down.
A CSV file containing the filtered devices and their column details (regardless of the columns selected in the All Devices view) is downloaded.
Column Sorting
If a custom filter results span more than 50 devices, the sorting options are not available for the following columns:
Device Status, Notes, Reboot required, PSA Integration, Patches pending, TeamViewer, Take Control, Remote Background, Backup & Recovery, Managed Antivirus, Web Protection, System Tray Application, Maintenance Mode, Disk Space Check, Ping Check, Windows/Daemon Service Check, TCP Service Check, Web Site Check, SNMP Check, Performance Monitoring Check, Web Protection Bandwidth Check, Antivirus Check, Backup Check, Drive Space Change Check, Exchange Check, Failed Login Check, Physical Disk Health Check, Patch Status Check, Critical Events Check, MySQL Check, Script Check, Backup & Recovery Threshold Check, Automated Task.