
Azure Dashboard
Cloud Commander will be decommissioned and stop functioning on May 13, 2026. You can use the product until that date.
Review and update workflows to remove any dependencies before the product is decommissioned.
Support, bug fixes, and security patches will be available until April 13, 2026.

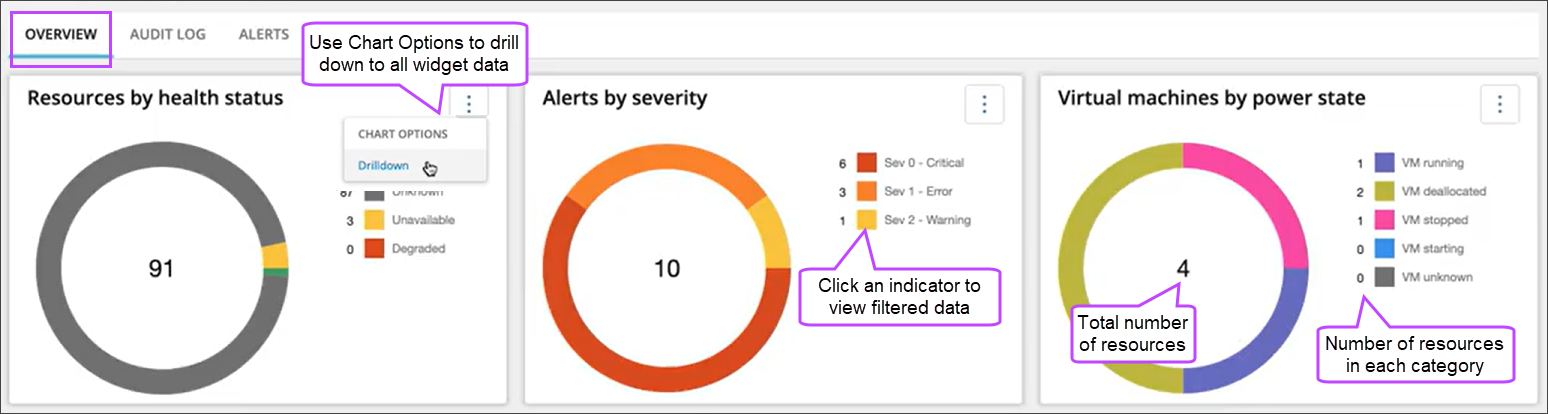
View and monitor the overall status of Microsoft Azure resources across your managed tenants to detect potential problems at-a-glance on the Azure Dashboard.
Drill down from each dashboard chart to view more specific data. When you select an indicator in a chart, the filtered data displays based on your selection.
From the Azure Dashboard, you can also view alerts and audit information. For more information, see Azure alerts and Azure Management Audit Logs.
Prerequisites
- You must be assigned the Azure Management Resource Reader, Writer, or Admin role.
View the Azure Dashboard
-
 Dashboards > Azure Dashboard
 - Go to Overview.
- Use the chart options or select an indicator to drill down to the filtered data.
The following charts display on the Overview:
| Chart | Description |
|---|---|
| Resources by health status | Number of Microsoft Azure resources in each health state. When you drill down from this Chart, the Azure Resources displays. |
| Alerts by severity | Number of alerts for each alert severity. When you drill down from this chart, the Alerts page displays. |
| Virtual machines by power state | Number of virtual machines in each power state. When you drill down from this chart, the Virtual Machines page displays. |
Updated: Jan 09, 2026