
Explore the Work Surface in Report Builder 3.0
Report Builder is a small report design tool that is installed on your report server as part of Microsoft SQL Server. This helps you create reports by using a familiar Microsoft Office–style interface. You can build simple statements or complex, data‑driven reports by using built‑in wizards or by writing your own queries. When you work with report templates, Report Builder connects to the correct shared data source automatically. When you create a new report, you need to add a data source before you can build datasets or visuals.
- Open Report Builder 3.0.

- Click Blank Report in the Getting Started wizard.
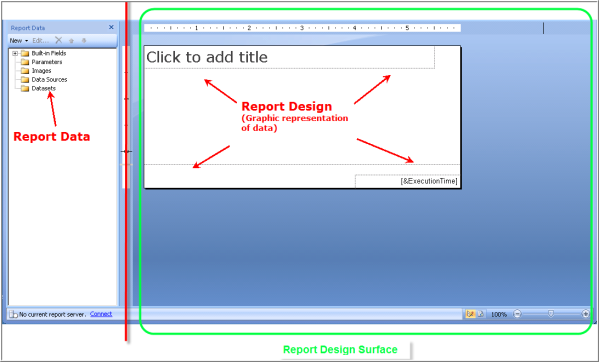
The work surface displays with a new blank report. The Report Builder work surface is divided into two sections:
- Report Data – Represented graphically in the left pane. This is where you can search the contents of the database, and collect the data to build datasets. Each report can have many datasets and each dataset can be used over and over within the same report.
- Report Design – In the right pane, and is separate from data collection. The report design area is where you will place report items, such as Report Parts, Subreports, tables, charts, text boxes, images and so on.
At the top of the Report Builder window is the ribbon menu with three tabs:
- Home tab: This is where you format text, and where you can preview the report by clicking the run button at the far left .
- Insert tab: This is where you will find all the items that you might want to insert into a report.
Insert tab tip: Click Insert > Report Parts to view the Report Part Gallery.
- View Tab: This is where you organize your workspace, and display the Report Data, Grouping, Report Properties and the Ruler.
View tab tip: Click View > Properties to view the Properties pane.