
How to Create a Missing Patches Report
These instructions describe creating a Missing Patches report using the Generic Template with no subscription, creating a dataset, and setting up a filter through the Query Designer.
The Generic Template includes the following Report Data:
- Built-in fields
- Parameters
- Connection to Data Sources (Config and Warehouse)
- Three datasets:
- DateFormat
- GetBrandingImage
- dsCustomerName
To create the Missing Patches report, we are going to add a new dataset, MissingPatches. Our new dataset will connect to the data source to retrieve the data we need for the report at run time.
- Open the Generic Template without subscription.
- Open Report Builder.
- Close the Getting Started page.
The work surface is displayed with a blank report in the design area.
- Open a Template on the report server by clicking the Report Builder icon in the upper-left corner of the window, and then click Open.
- Navigate to your Report Manager server.
If you don’t see a folder listing, type
http://IP/ReportServer/in the address bar and click Open. - Click Templates.

- Select and Open the GenericNoSubscription_Template.
The GenericNoSubscription_Template displays in the Report Design area.

- Rename and save the new report locally.
- Click in the report title text box (it currently displays Custom Report Template No Subscriptions) and type: Missing Patches Report.
- Save the report locally as a new name, Missing Patches Report Custom. This is the name that will appear as the title of the report in the Reports Console and in the list of reports in the Administration Console. For more information about saving the report locally, see Setting Up an Account for Working in Report Builder.

- Add a new dataset.
What is a dataset?
A dataset includes a connection to a data source, the query to execute and a field list of the data types that will appear in the report. A report file can have multiple datasets.
In general, when creating a custom report, add as many fields as you think you might possibly use to a dataset.
- In the Report Data pane, click Datasets., then click Add Dataset.

- Type in a new Name for the dataset: MissingPatches (no spaces in the name).
- Select Use a dataset embedded in my report.
An embedded dataset is one that you will create here and it will be used by this report only.
A shared dataset is one that has been created and saved on the report server. You would have to browse to locate it. - Select the Warehouse in the Data source drop-down list.
- Click Query Designer.
The Query Designer allows you to pick the fields you want to include in the report. You can drag fields from the left pane of the Query Designer to the right pane to build an expression that will evaluate and pull data into the report at run time.
- In the Entities list, select the Dim Customer table.
When a table is selected, the fields are filtered and the those now available for selection are related to the selected table. In this case, the fields available are related to Dim Customer.
- In the Fields list, select Customer Name and drag it to the right pane and drop it in the collection field.
- In the Entities list, click Dim Devices. The Dim Devices table has fields that will provide information about devices for our Missing Patches report, such as device class and device name.
Tables are not in alphabetical order, so you can use the search button or scroll.
- In the Fields list, click Device Class and drag it into the collection field.
- Do the same for Device Name.
When you drag a field into the collection screen, look for the blue bar before dropping the field.

If you drag a field into the collection screen by mistake, right-click the column and click Delete.

Widen the columns so you can see the names by clicking a column and dragging the right column edge over.
- In the Entities list, click Fact Cim Missing Patches ( it's near the bottom of the list of tables). This table has the information about the missing patches that we can provide in the report.
- From the Fields list, select and drag the following into the collection pane:
- Product
- Patch Name
- Installation Status
- Release Date
- Click OK.
- Click OK.
- In the left hand pane, you can see the new dataset: MissingPatches.
- In the Report Data pane, click Datasets., then click Add Dataset.
- Insert a table.
Now that a dataset has been created with the fields specific to reporting on missing patches, we can go ahead and select a layout for the presentation of the data in the report.
- Click Insert > Table >Table Wizard.
- In the New Table or Matrix wizard, select Choose an existing dataset in this report or a shared dataset.
- Select the existing dataset, MissingPatches.
- Click Next.
- We are going to use all the Available fields to make up the rows in our report. Press Shift and click all the Available fields to the Row groups box.
- Because this screen won't let you leave without placing something in the Values column, drag any field from Available fields into Values.
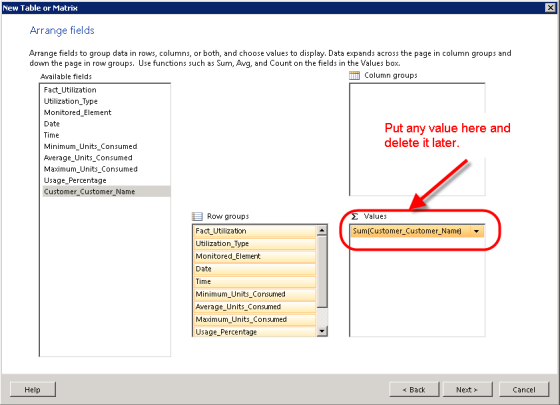
- Click Next.
- On the Choose the layout (for the table) screen, clear the check boxes.
For any asset report, disable both check boxes. If you are creating a CPU Utilization report, for example, keep the first one checked, however, always clear the last.
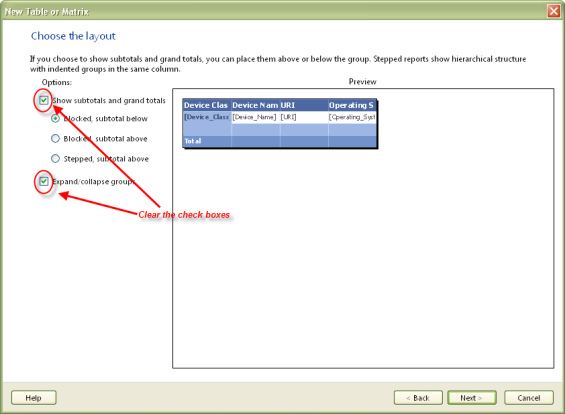
- Click Next.
- Choose a style for the report.
- Click Finish.
- The Report Design surface appears with the table.

To edit a dataset, right-click the Dataset in the Report Data pane and select Query.
- Remove the Values column.
Why did we need a field in Values?
You must put a field in the Values box in order to leave the Arrange Fields screen. Report Builder has been designed to suit a wide audience and, in particular, business accounting. Values are useful when you need to create totals and subtotals. Report Manager users might need fields in the Values column, for example, if we were creating a CPU Utilization Report.On the far right of the table will be the Values column that we were forced to add to the report just to leave the screen, Arrange Fields. We cannot remove it, but we can hide it from view. We also need to conserve real estate in our report layout.
- Click in the table to select it.
- Click the column itself to select it.
- Right-click the column top border to display the menu:
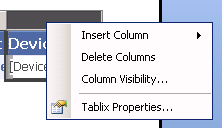
- Click Column Visibility.
- In the Change display options dialog, select Hide.
When the report is run, this column will not be visible.
- Set up a filter on a customer.
We need to set up a filter so that the report will only display information for one selected customer at a time. If not, the report will display information for every customer.
- In the Report Data pane, right-click the dataset, MissingPatches.
- Click Query.
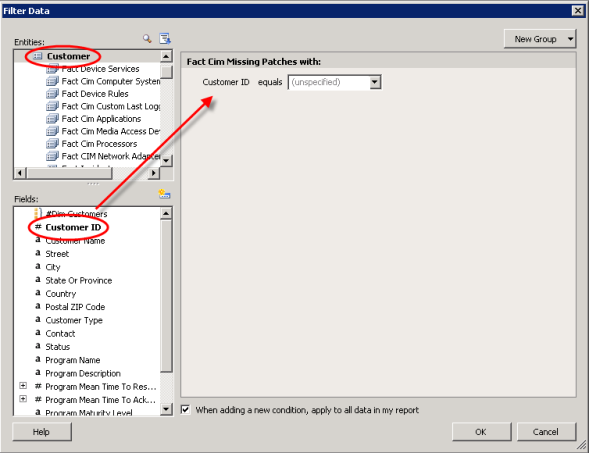
- Click Filter.
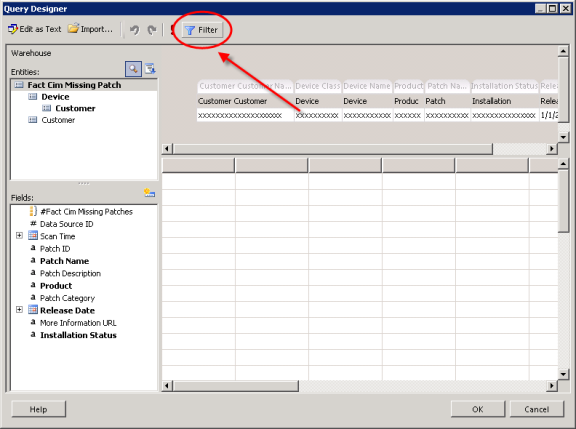
- Select the Customer table in the Entities list box.
- In the Fields list box, select and drag (or double click) Customer ID to move it to the query design pane.
Why do we filter on Customer ID and not Customer Name?
Report Manager uses Customer ID to map to the Customer List UI control. IDs are always used for filters.
Using IDs instead of names to identify customers makes good sense, from a database perspective. It promotes scalability.Report Manager stores data for a long time and if a customer is removed from Report Manager and subsequently returns, the customer name may be the same, but the Customer ID will always be unique. In addition, if you have multiple servers, it avoids confusion of different customers with the same name. - In the Query design pane, right-click Customer ID and select Prompt.
By selecting Prompt for Customer ID, the user will be prompted to provide a Customer ID for the report at runtime.
To preview reports in Report Builder you will need ID numbers for many parameters.
- In the Administration Console, go to the Advanced settings page and enable the Real-time display of Report Values.
- In the Reports Console, run any report with the parameters for which you require the ID numbers.
The parameter values table appears at the bottom of the screen.
- Click OK.
- Click OK.
- Right-click Parameters in the left column to see that creating a filter with a prompt has added a new parameter to the report, Customer_ID.
- Preview the report in Report Builder.
- Upload the report to Report Manager. See Manage Custom Reports in Report Manager for more information.