
How to Create a CPU and Disk Utilization Report
Report Parts not SupportedBeginning with Release 5.0, new installations will not include Report Parts. All references from the reports are removed including datasets, structure, tables, and branding. If you have upgraded to Release 5.0, Reports Parts remain but will not be supported. |
Report Parts are tables, charts, graphs, and images that have been created and formatted from existing reports. They contain datasets, structure, tables, and branding. They have the same dependencies and configuration details as the parent reports. Using Report Builder 3.0, you can drag and drop report parts to create a custom report. For more on N-able N-central dependencies, refer to N-able N-central Dependencies.
These instructions describe creating a CPU and Disk Utilization report (a customized Technical Summary repprt) using the generic template, and adding Report Parts to the template.
Before creating this custom report, make sure you have set up an account and accessed Report Builder, and reviewed creating a CPU and Disk Utilization Report.
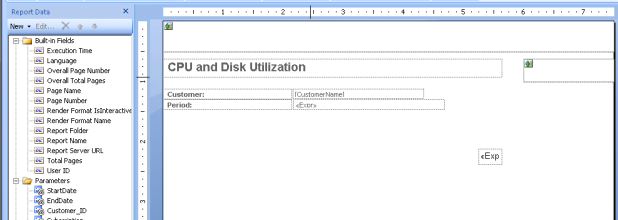
The Generic Template includes the following Report Data:
- Built-in fields
- Parameters
- Connection to Data Sources (Config and Warehouse)
- Three datasets:
- DateFormat
- GetBrandingImage
- dsCustomerName
- Use the following workflow for all reports using Report Parts:
You will need the filename of the Report Part or Parts that you will use.
- Open Report Builder.
- Open the Generic Template for Scheduling (for IT reports), or the Generic Template (for Asset or other point-in-time reports).
- For each Report Part you would like to use:
- Locate the section, Name to search on in the Report Part Gallery.
- Record the name that you use in a list.
- Copy the name from the documentation and return to Report Builder.
- Paste the name into the search window of the Report Part Gallery.
- Click and drag report parts into the report layout and format them.
- Save the report locally and upload the report to Report Manager.
- Open the Template and save it locally:
- Open Report Builder.
- Close the Getting Started page.
The work surface is displayed with a blank report in the design area.
- We are going to open a Template on the report server. In the upper left-hand corner of Report Builder, click the icon and click Open.
- Navigate to your Report Manager server.
- Click Templates.
- Click to open Generic Template for Scheduling. The Generic Template for Scheduling displays in the Report Design area.
- Rename and save the report locally
- Rename the report in the Report Design Surface. Click into the report title text box and type: CPU and Disk Utilization.
- Save the report locally to a new name: CPU and Disk Utilization. This is the name that will appear as the title of the report in the Reports Console and in the list of reports in the Administration Console.
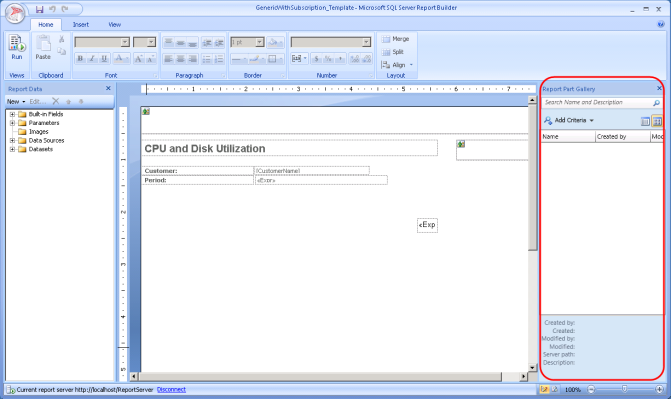
- Add Report Parts to the Template:
- After the Report is saved, add Report Parts to the Template. If the Report Part Gallery is not already displayed, on the menu bar click Insert > Report Parts to display the Report Part Gallery.

The Report Part Gallery is displayed on the right-hand side of the report layout.
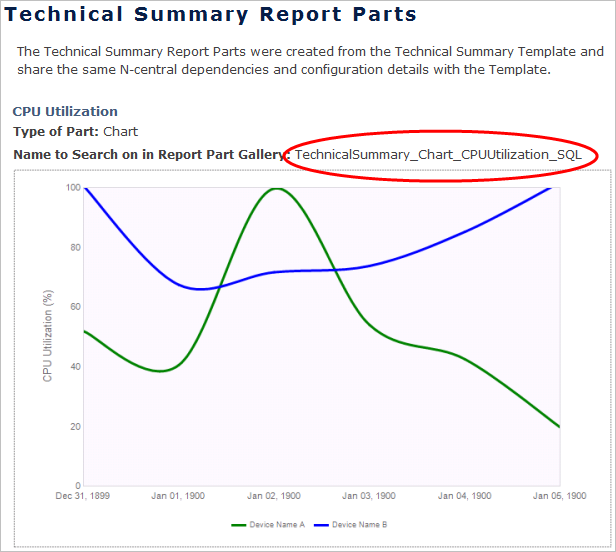
- Go to Technical Summary Report Parts, and locate the CPU Utilization Report Part. Locate the Name to search on in the Report Part Gallery: TechnicalSummary_Chart_CPUUtilization_SQL.
- Locate the next Report Part, CPU Utilization Report part, the Name to search on in the Report Part Gallery: TechnicalSummary_Chart_CPUUtilization_SQL.
- Copy the name from the documentation and paste it into the Search Name and Description window in the Report Part Gallery.
- Make a note (copy to a file or jot down on paper) of the names of Report Parts that you use in the creation of a report. Then, when you go to configure the UI controls, you will know which Report Part topics in the online help to refer to for the order and configuration of UI controls.
You can use partial names to search and then select the Report Part from the search results.
- Click the search icon in the window.
The Report Part Gallery refreshes to display the link to the report part.

You can toggle between viewing the link to the Report Part as Details or Thumbnail.
- Click and drag the Report Part link into the design surface of the report. This pulls the Report Part and the associated datasets into the report.
- Use the handles to drag it to the far left of the design pane so that it lines up with the edge and drop it.
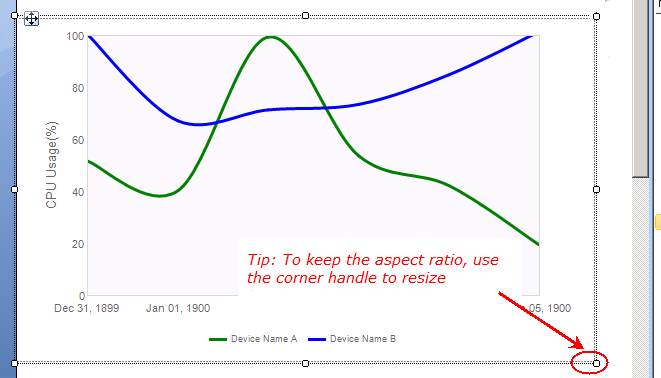
Display the ruler (in the main menu, click View > Ruler), if you wish to adjust the size any report element, report part, table. To keep the aspect ratio, use the corner handle to resize an element. This is not necessary, as the Template takes care of all formatting when a Report Part is drawn in, but it's a good thing to know.
How do I remove a Report Part inserted by mistake?
- If you make a mistake and insert the wrong report part, click Undo and the report part and associated datasets will be removed.
- If you realize that you have made a mistake and after many changes (or a save) you would like to remove a Report Part, you will need to move all associated datasets and parameters by hand (locating them in the Reports Data pane and deleting them by right-click > Delete).
Using Delete to remove a Report Part will leave the associated datasets behind and you will end up with extra datasets and unused parameters in your report.
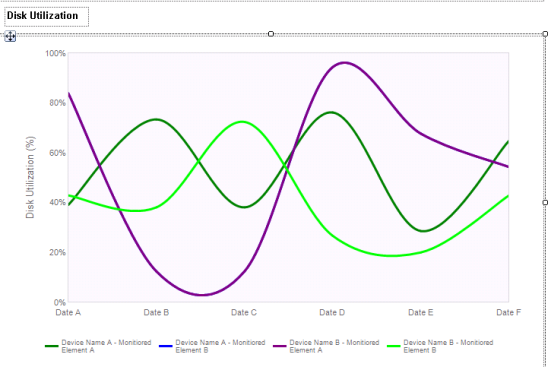
- To add a second Report Part, go back to Technical Summary Report Parts and locate the Disk Utilization Report Part section. The Name to search on in the Report Part Gallery is TechnicalSummary_Chart_DiskUtilization_SQL.
- Copy the name from the documentation and paste it into the Search Name and Description window in the Report Part Gallery.
- Make a note (copy to a file or jot down on paper) of the names of Report Parts that you use in the creation of a report. Then, when you go to configure the UI controls, you will know which Report Part topics in the online help to refer to for the order and configuration of UI controls.
You can use partial names to search and then select the Report Part from the search results.
- Click the search icon in the window.
- The Report Part Gallery refreshes to display the link to the report part.
Drag it to the report under the CPU Utilization chart.

- Add titles to the sections:
- Click Insert > Text Box and click in the layout, under the title.
- Type CPU Utilization in the text box and drag it into place.
- Select CPU Usage and make it bold.
- Move the second chart down to make room for a title.
Use the handle with the 4 bi-directional arrows to drag the report part around so that you don't lose the aspect ratio.
- Click Insert > Text Box and click in the layout, above the second report part.
Alternatively, you could copy the box you just created and paste it.
- Type Disk Utilization in the text box and drag it into place.
- To this point, we have concerned ourselves with the presentation of the report. To view the data that is now associated with this report, find the Report Data pane to the left of the Report Builder screen and click to expand Parameters and Datasets. All the data necessary for the generation of the report has been pulled into the report file by the Report Parts.

- Save the report.
- Preview the report in Report Builder.
- Upload the report to Report Manager.
- After the Report is saved, add Report Parts to the Template. If the Report Part Gallery is not already displayed, on the menu bar click Insert > Report Parts to display the Report Part Gallery.