
Visualize assets data
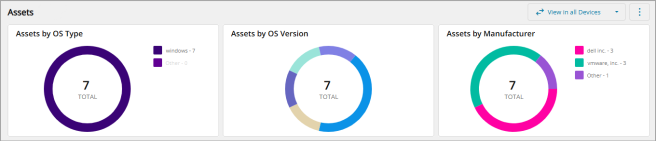
The Assets view dashboard offers visual representations of data, such as charts and graphs, all in one place to help you track multiple metrics effectively. It simplifies large data sets into easy-to-understand formats, making patterns, trends, and insights clear.
Use Assets view visualizations and table options to:
- Select one or more chart elements to filter on multiple data points.
- Filter or sort by columns or use the more detailed Filter Builder options.
- Search for a specific device using the search box or use the column searches to find groups of devices.
- Choose the columns to display, drag and drop columns to move, and fix columns to the right or left.