Create a new dashboard
You can create new dashboards in Analytics based on existing dashboards and customize them with specific data and visuals. Customize your reports using filters, visualizations, and data. See Power BI Report Editor for details about the report editor. For details about Visualizations, see Microsoft Power BI visualizations.
In Analytics, there are two ways to create a new dashboard; based on a default dashboard and a custom dashboard.
Create a dashboard based on a default dashboard
-
Go to Analytics > Dashboards.
-
Select the Default type filter and then select the dashboard.
-
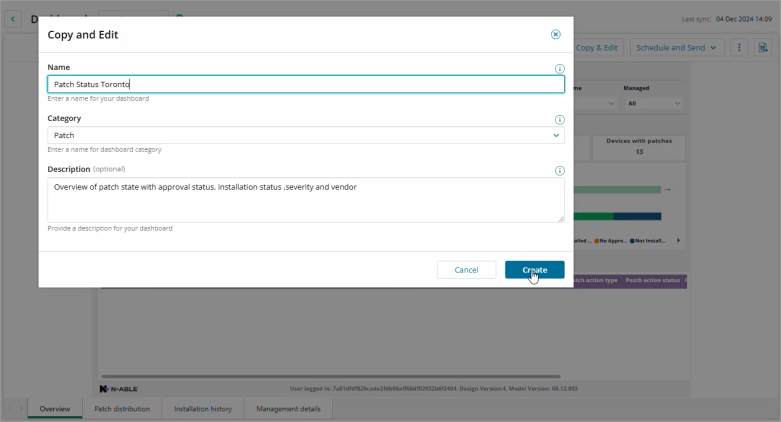
At the top of the dashboard, click Copy & Edit.

-
Enter a name for the dashboard.
-
Select a category for the dashboard or enter a name to create a new category.
-
Click Create.
Create a dashboard based on a custom dashboard
-
Go to Analytics > Dashboards.
-
Select the Custom type filter and then select the dashboard.
-
Click Edit Dashboard Mode toggle.
-
Edit the dashboard.
-
From the toolbar File menu, select Save As.
-
Enter and name and description for the dashboard.
For details about Visualizations, see Microsoft Power BI visualizations.
To replace visuals on the dashboard
-
Click the visual on the dashboard.
-
In the Visualization panel, select the visualization that you want to replace the current one with.
-
Click the Save icon.
