
Executive Summary report
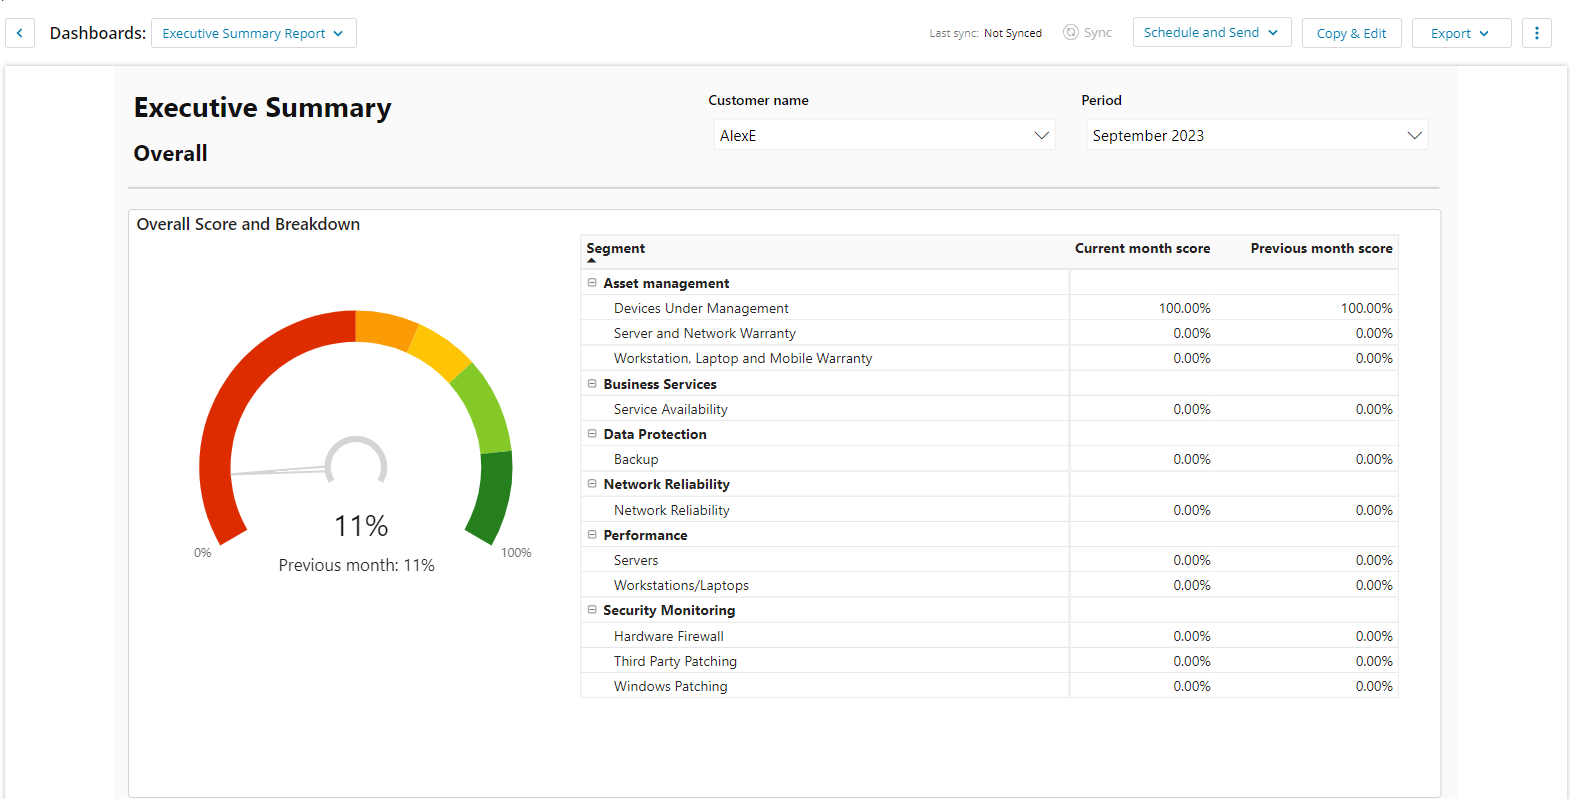
The Executive Summary report presents a high‑level view of IT service performance across a customer’s environment using glance‑and‑know scorecards. It summarizes key activity and health indicators for a selected reporting period in a format designed for quick executive review.
The report becomes available after enough data has been collected (at least one month). The report presents high‑level scorecards and supports selecting sections and levels of detail, which makes it easy to review and share with stakeholders.
How report sections work
The Executive Summary report presents performance scorecards and can include additional details across all areas of a customer’s network.
Each section of the report is optional. For each included section, the report supports these levels of detail:
-
Scorecard only
-
Scorecard with a summary
-
Scorecard with a summary and detailed data
Audience
-
Executives (with scorecards)
-
IT personnel
-
CIOs
ESR overall metrics definitions
| Segment | Metric | Definition | Criteria |
|---|---|---|---|
|
Asset Management |
Devices Under Management |
Number of Managed Devices as a proportion of Manageable Devices |
Ignored Devices not included |
|
Asset Management |
Server and Network Warranty |
Managed Devices with a valid or soon to expire warranty date as a proportion of all Managed Devices with a warranty date |
Does NOT include these Device Classes: Generic Laptop, Generic Workstation, Mobile Device, Windows Laptop, Windows Workstation |
|
Asset Management |
Workstation, Laptop and Mobile Warranty |
Managed Devices with a valid or soon to expire warranty date as a proportion of all Managed Devices with a warranty date |
Includes these Device Classes: Generic Laptop, Generic Workstation, Mobile Device, Windows Laptop, Windows Workstation |
|
Data Protection |
Backup |
Number of backup jobs completed as a proportion of all attempted backups |
Completed backup jobs include those that are successful and those successful with warnings |
|
Network Reliability |
Network Reliability |
Active uptime as a proportion of total available uptime. |
Utilizes the Agent Status service or the Connectivity service. |
|
Performance |
Servers |
Total number of Devices with normal status and warning status (success) as a proportion of all monitored Devices |
Includes these Device Classes: ESXi Server, Generic Server, Windows ServerOnly includes these service: CPU, Disk, Memory |
|
Performance |
Workstation/Laptops |
Total number of Devices with normal status and warning status (success) as a proportion of all monitored Devices |
Includes these Device Classes: Generic Workstation, Windows Laptop, Windows WorkstationOnly includes these service: CPU, Disk, Memory |
|
Security Monitoring |
Hardware Firewall |
Total number of Devices being monitored for Firewalls as a proportion of all Managed Devices in Switch/Router Class |
Only Devices in the "Switch/Router" device class and with a service starting with "FW-"Does Not include custom services |
| Overall Overall Score A simple average of all the scores of all the metrics. | Overall Overall Score A simple average of all the scores of all the metrics. | Overall Overall Score A simple average of all the scores of all the metrics. |
ESR Sub-pages
| Domain | Category | Metric | Definition | Criteria |
|---|---|---|---|---|
|
Asset Management |
Devices Under Management |
Managed |
Managed: Percentage and count of managed devices by manageable devices, listed per Device Class |
Ignored Devices not included |
|
Asset Management |
Devices Under Management |
Added/Removed |
Added/Removed: Shows the total sum of any devices added or removed during the report period. (e.g. if 1 was removed and 2 added, the result is 1) |
Ignored Devices not included |
|
Asset Management |
Devices Under Management |
Score % |
Score: Number of Managed Devices as a proportion of Manageable Devices |
Ignored Devices not included |
|
Asset Management |
Server and Network Warranty |
Devices with valid warranties (90+ days until expiry) |
Managed Devices with a valid warranty as a proportion of all Managed Devices |
Does NOT include these Device Classes: Generic Laptop, Generic Workstation, Mobile Device, Windows Laptop, Windows Workstation |
|
Asset Management |
Server and Network Warranty |
Devices with warranties that will expire soon (within 90 days) |
Managed Devices with a soon to expire warranty as a proportion of all Managed Devices |
Does NOT include these Device Classes: Generic Laptop, Generic Workstation, Mobile Device, Windows Laptop, Windows Workstation |
|
Asset Management |
Server and Network Warranty |
Devices with expired warranties |
Managed Devices with an expired warranty as a proportion of all Managed Devices |
Does NOT include these Device Classes: Generic Laptop, Generic Workstation, Mobile Device, Windows Laptop, Windows Workstation |
|
Asset Management |
Server and Network Warranty |
Score % |
Managed Devices with a valid or soon to expire warranty date as a proportion of all Managed Devices with a warranty date |
Does NOT include these Device Classes: Generic Laptop, Generic Workstation, Mobile Device, Windows Laptop, Windows Workstation |
|
Asset Management |
Workstation, Laptop and Mobile Warranty |
Devices with valid warranties (90+ days until expiry) |
Managed Devices with a valid warranty as a proportion of all Managed Devices |
Includes these Device Classes: Generic Laptop, Generic Workstation, Mobile Device, Windows Laptop, Windows Workstation |
|
Asset Management |
Workstation, Laptop and Mobile Warranty |
Devices with warranties that will expire soon (within 90 days) |
Managed Devices with a soon to expire warranty as a proportion of all Managed Devices |
Includes these Device Classes: Generic Laptop, Generic Workstation, Mobile Device, Windows Laptop, Windows Workstation |
|
Asset Management |
Workstation, Laptop and Mobile Warranty |
Devices with expired warranties |
Managed Devices with an expired warranty as a proportion of all Managed Devices |
Includes these Device Classes: Generic Laptop, Generic Workstation, Mobile Device, Windows Laptop, Windows Workstation |
|
Asset Management |
Workstation, Laptop and Mobile Warranty |
Score % |
Managed Devices with a valid or soon to expire warranty date as a proportion of all Managed Devices with a warranty date |
Includes these Device Classes: Generic Laptop, Generic Workstation, Mobile Device, Windows Laptop, Windows Workstation |
|
Data Protection |
Backup |
Successful Backups |
Number of successful backup jobs completed as a proportion of all attempted backups |
Backup state is normal |
|
Data Protection |
Backup |
Backups completed with warnings |
Number of backup jobs in a warning state completed as a proportion of all attempted backups |
Backup state is success with warnings |
|
Data Protection |
Backup |
Failed backups |
Number of backup jobs in a failed state completed as a proportion of all attempted backups |
Backup state is failed |
|
Data Protection |
Backup |
Score % |
Number of backup jobs completed as a proportion of all attempted backups |
Completed backup jobs include those that are successful and those successful with warnings |
|
Network Reliability |
Network Reliability |
Network Reliability |
Active uptime as a proportion of total available uptime split by Device Class |
Switch/Router, ESXi Server, Generic Server, Windows ServerUtilizes the Agent Status service or the Connectivity service. |
|
Network Reliability |
Network Reliability |
Score % |
Active uptime as a proportion of total available uptime |
Switch/Router, ESXi Server, Generic Server, Windows ServerUtilizes the Agent Status service or the Connectivity service. |
|
Performance |
Servers |
Servers within capacity |
Total number of Devices with a normal status as a proportion of all monitored Devices |
Includes these Device Classes: ESXi Server, Generic Server, Windows ServerOnly includes these service: CPU, Disk, Memory |
|
Performance |
Servers |
Servers reaching capacity |
Total number of Devices with a warning status as a proportion of all monitored Devices |
Includes these Device Classes: ESXi Server, Generic Server, Windows ServerOnly includes these service: CPU, Disk, Memory |
|
Performance |
Servers |
Servers exceeding capacity |
Total number of Devices with at least 1 failed status as a proportion of all monitored Devices |
Includes these Device Classes: ESXi Server, Generic Server, Windows ServerOnly includes these service: CPU, Disk, Memory |
|
Performance |
Servers |
Score % |
Total number of Devices with normal status and warning status (success) as a proportion of all monitored Devices |
Includes these Device Classes: ESXi Server, Generic Server, Windows ServerOnly includes these service: CPU, Disk, Memory |
|
Performance |
Workstation/Laptops |
Workstation/Laptops within capacity |
Total number of Devices with a normal status as a proportion of all monitored Devices |
Includes these Device Classes:Generic Workstation, Windows Laptop, Windows WorkstationOnly includes these service: CPU, Disk, Memory |
|
Performance |
Workstation/Laptops |
Workstation/Laptops reaching capacity |
Total number of Devices with a warning status as a proportion of all monitored Devices |
Includes these Device Classes:Generic Workstation, Windows Laptop, Windows WorkstationOnly includes these service: CPU, Disk, Memory |
|
Performance |
Workstation/Laptops |
Workstation/Laptops exceeding capacity |
Total number of Devices with a failed status as a proportion of all monitored Devices |
Includes these Device Classes:Generic Workstation, Windows Laptop, Windows WorkstationOnly includes these service: CPU, Disk, Memory |
|
Performance |
Workstation/Laptops |
Score % |
Total number of Devices with normal status and warning status (success) as a proportion of all monitored Devices |
Includes these Device Classes:Generic Workstation, Windows Laptop, Windows WorkstationOnly includes these service: CPU, Disk, Memory |
|
Security Monitoring |
Hardware Firewall |
Monitored |
Total number of Devices being monitored for Firewalls as a proportion of all Managed Devices in Switch/Router Class |
Only Devices in the "Switch/Router" device class and with a service starting with "FW-"Does Not include custom services |
|
Security Monitoring |
Hardware Firewall |
UnMonitored |
Total number of Devices not being monitored for Firewalls as a proportion of all Managed Devices in Switch/Router Class |
Only Devices in the "Switch/Router" device class and with a service starting with "FW-"Does Not include custom services |
|
Security Monitoring |
Hardware Firewall |
Score % |
Total number of Devices being monitored for Firewalls as a proportion of all Managed Devices in Switch/Router Class |
Only Devices in the "Switch/Router" device class and with a service starting with "FW-"Does Not include custom services |